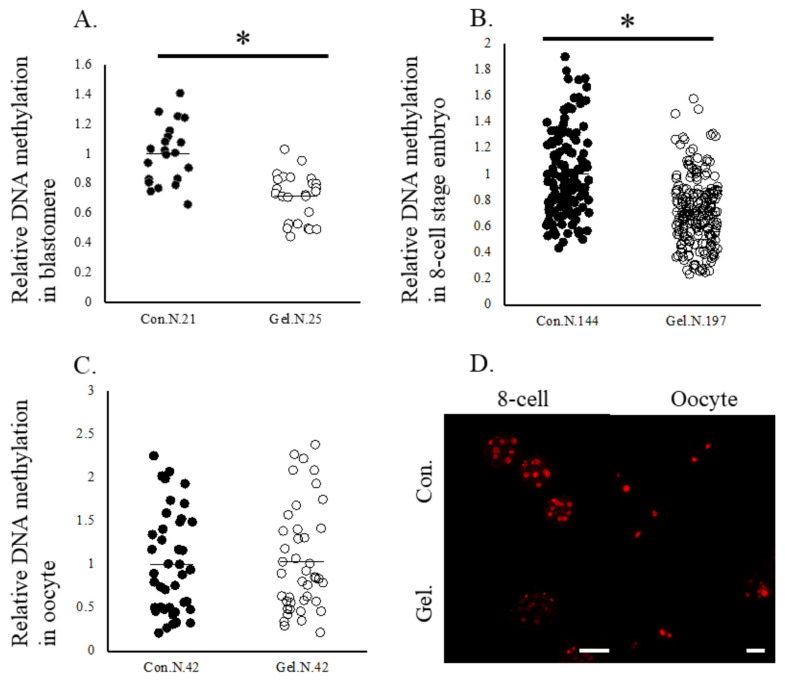
Figure 3.
DNA methylation levels in oocytes and 8-cell stage embryos. Oocytes were cultured on plates (Control) or gel culture system (Gel) and matured oocytes and resultant 8-cell stage embryos were subjected to immunostaining. Relative expression levels of DNA methylation in blastomeres (A), in 8-cell stage embryos (B), and oocytes (C). Data are normalized to that of the control. * p < 0.05. N, number of oocytes examined. (D), representative pictures of oocytes and 8-cell stage embryos. Bar, 100 μm.

