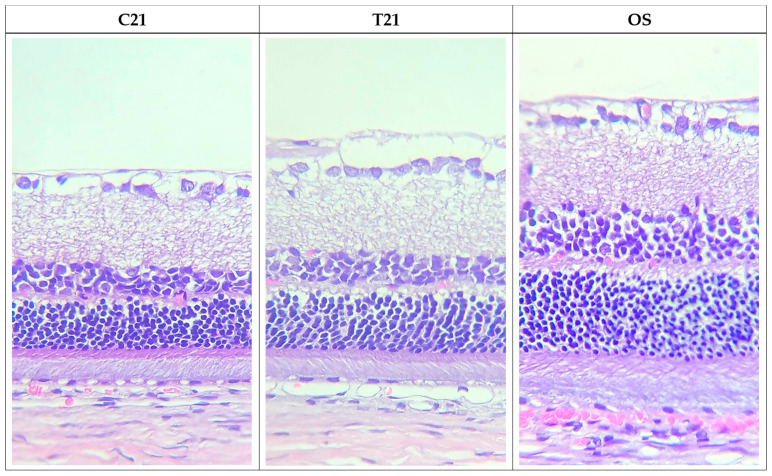
Figure 5.
Photomicrographs of retinal sections from the OD, 21 days after glaucoma induction, from the control group (C21) and treated group (T21), and from a non-glaucomatous eye (OS; n = 4). We can observe that the improvement in retinal thickness was more pronounced in the treated group. Hematoxylin and eosin staining, 40 magnification.

