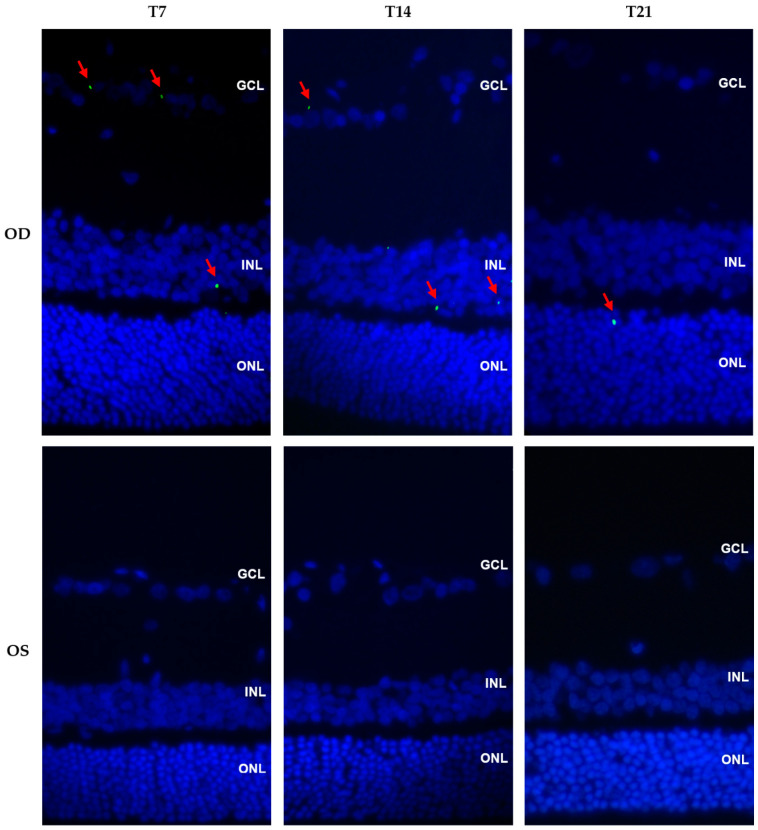
Figure 6.
Immunofluorescence photomicrographs showing cross sections of the OD (treated eye) and OS (control eye) in the treatment groups T7, T14, and T21 (magnification 40). Images show the merging of green and blue filters. Red arrows indicate EPOβ stained in green and cell nuclei are stained in blue with DAPI. GCL, ganglion cell layer; INL, inner nuclear layer; ONL, outer nuclear layer.

