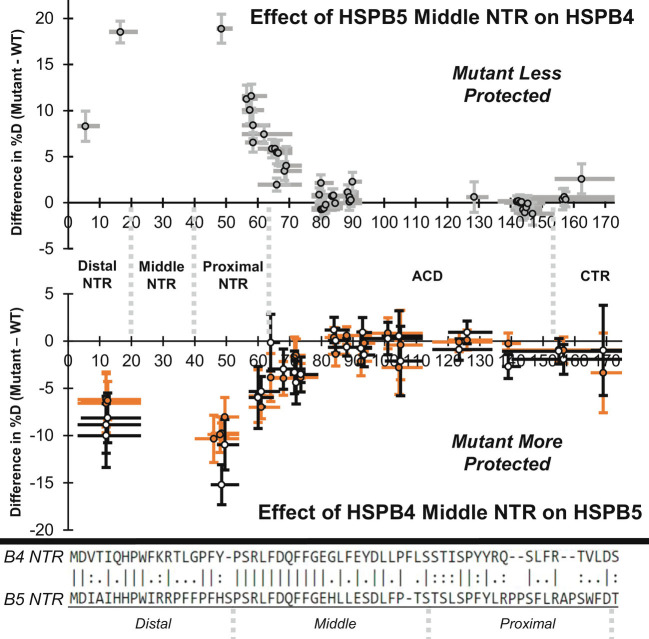
Fig. 2.
The NTR Middle subregion affects HDX throughout the NTR. Data shown are for a 4-s exchange time point. Top panel: The effect of swapping HSPB5’s Middle NTR subregion into HSPB4 (454-B4) is shown in gray as the difference in percent deuteration (mean 454-B4 %D—mean HSPB4 %D; N = 3 to 7). Values above 0 indicate 454-B4 is less protected from exchange than HSPB4. Gray circles outlined in black represent the peptide center, horizontal bars represent peptide length (minus the first two residues), and vertical error bars show error (±1 SD). Lower panel: The effect of swapping HSPB4’s Middle NTR subregion (545-B5) or the residue swaps H31G/L33F/S35Y (B5-GFY) in HSPB5 are shown in black and orange as the difference in percent deuteration (mutant mean %D—HSPB5 mean %D). Values below 0 indicate the mutants are more protected from HDX. N = 3 to 7, change in mean %D value ±1 SD is shown. Boundaries of the Distal NTR, Middle NTR, Proximal NTR, ACD, and CTR are shown between the panels. Bottom: Alignment of HSPB4 and HSPB5 NTR with the Distal, Middle, and Proximal NTR subregions shown.

