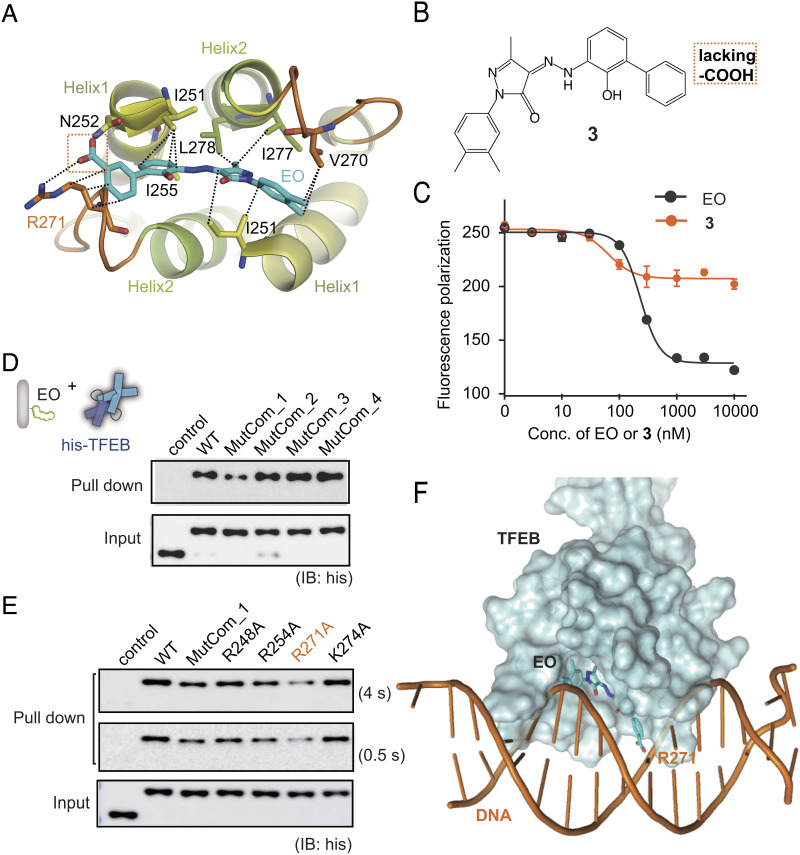
Fig. 4.
MOA of EO on TFEB. (A) EO is recognized of by TFEB through the HLH hydrophobic helix bundle according to molecular docking and dynamics simulation. (B) Chemical structure of compound 3 which lacks the carboxyl group compared with EO. (C) Compound 3 showed significantly lower inhibition activity against TFEB-DNA interaction than EO in the fluorescence anisotropy assay. Error bars represent the SEMs of four repeats. (D) Pull-down analysis of the interactions between EO and His-tagged TFEB WT, MutCom_1, MutCom_2, MutCom_3, and MutCom_4, using EO-Biotin immobilized on streptavidin beads. The precipitated TFEB proteins were analyzed by anti-His antibody. (E) Pull-down analysis of the interactions between EO and His-tagged TFEB WT, MutCom_1, R248A, R254A, R271A, and K274A. A representative result was shown with long exposure time (4 s) and short exposure time (0.5 s). (F) The CLEAR DNA is modeled onto the TFEB crystal structure using MITF-DNA complex (protein data bank code: 6KWI) as a reference. EO binding on the bottom surface of HLH region induces significant steric hindrance preventing further DNA binding.

