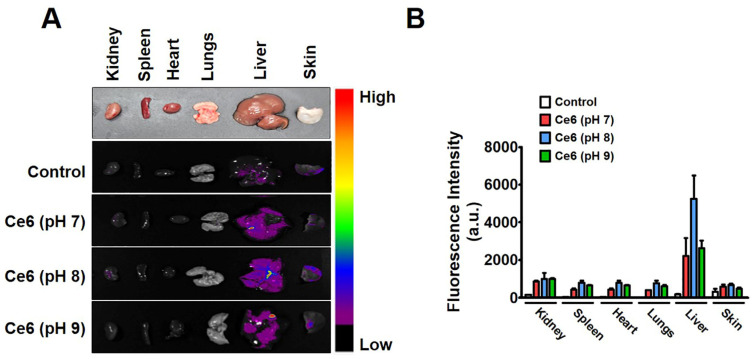
Figure 3.
In vivo biodistribution of Ce6 (pH 7, 8, and 9) treatment groups in C57BL/6 mice. (A). Ex vivo fluorescence images of the dissected organs (kidney, spleen, heart, lungs, liver, and skin) 2 h post injection of Ce6 solutions at pH 7, 8, and 9 in C57BL/6 mice. (B). Quantitative signal analysis of organs (kidney, spleen, heart, lungs, liver, and skin). Data were presented as mean ± SD (n = 3).

