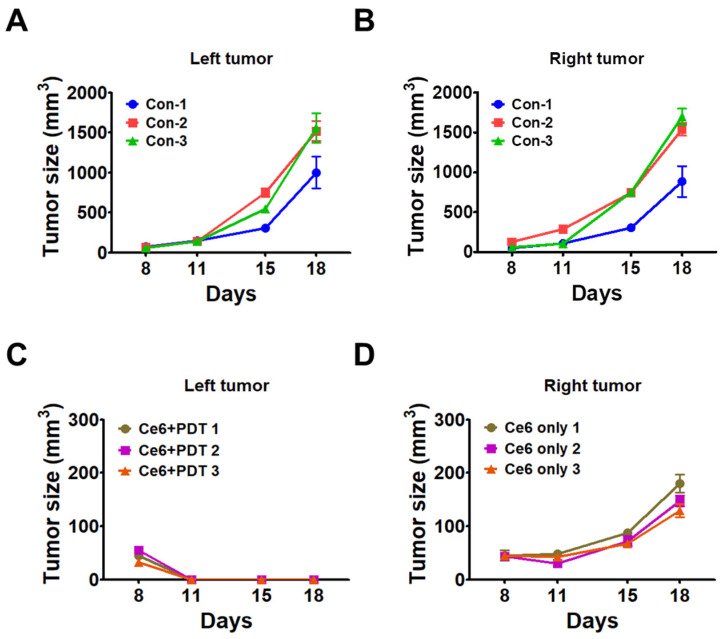
Figure 5.
Tumor volume changes in control and Ce6-PDT groups with tumors in the left and right flanks. The mice were subcutaneously injected at the left and right flank with 0.1 mL of B16F10 cells (1 × 10⁶ cells/mL). The vehicle control was injected with normal saline. (A) Changes in volume of the left tumor in the control group. (B) Changes in volume of the right tumor in the control group. (C) Changes in volume of irradiated left tumor in Ce6-PDT group. (D) Volume changes of the non-irradiated right tumor in the Ce6-PDT group. The data are the representation of mean ± SEM (n = 3).

