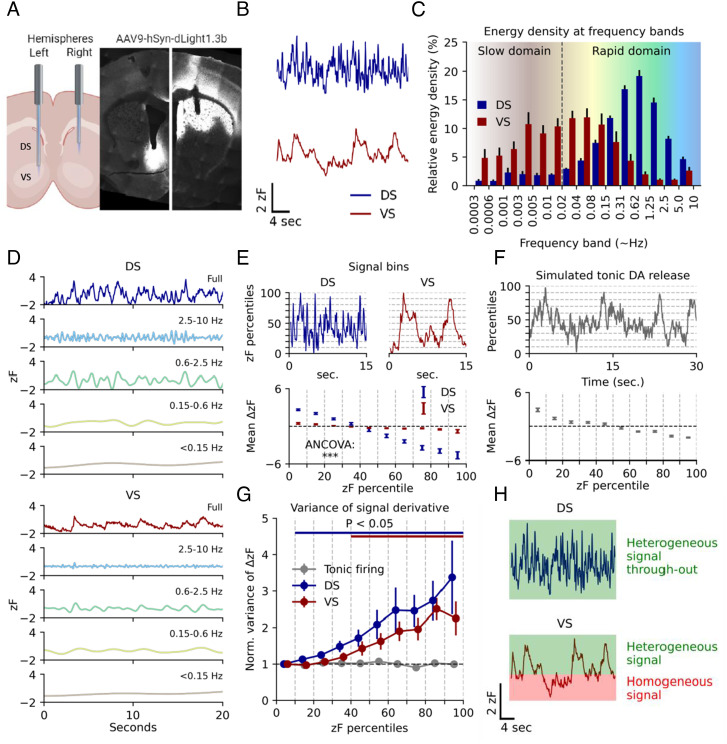
Fig. 1.
Basal DA dynamics differ between DS and VS during self-paced exploratory activity. (A) Injection of AAV9-hSyn-dLight1.3b in the right DS and left VS of Th-Cre mice followed by implantation of 200-µm optical fibers. Histology on coronal sections of the striatum show dLight1.3b expression and fiber location. (B) Representative traces from right hemisphere DS and left hemisphere VS DA fluctuations as assessed by dLight1.3b fluorescence measured during self-paced exploratory activity in an open-field arena that the mice had been exposed to two to three times before. (C) Spectral energy density of the two regions by frequency band. Error bars indicate SEM, n = 8 mice. (D) Representative frequency domains for DS and VS isolated by multiresolution analysis of the maximal overlap discrete wavelet transform. Colors match the corresponding domain in (C). (E) Top: Representative traces of VS and DS split into percentile bins of 10 across fluorescence amplitudes. Bottom: First-order derivative for each percentile bin of fluorescence amplitude for both regions. Error bars indicate SEM, n = 8 mice, ANCOVA, region:percentiles, F = 1,199.5, P = 1.8E-16). (F) Top: Poisson-driven tonic DA simulation. Fluctuations are present despite the temporally uniform process. Dashed lines indicate amplitude percentiles. Bottom: First-order derivative for each percentile bin of fluorescence amplitude. Error bars indicate SEM, n = 10 simulations. (G) Variance of the first-order derivative for each percentile bin normalized to bottom 10th percentile for simulated tonic release and DS and VS measurements. Error bars indicate SEM, P < 0.05 indicated by bars matching region color, Student’s t test, H0 = 1, multiple comparisons corrected for each percentile with the Benjamini–Hochberg procedure (α = 0.05). (H) Conceptual Figure of interpretation of data in (G).

