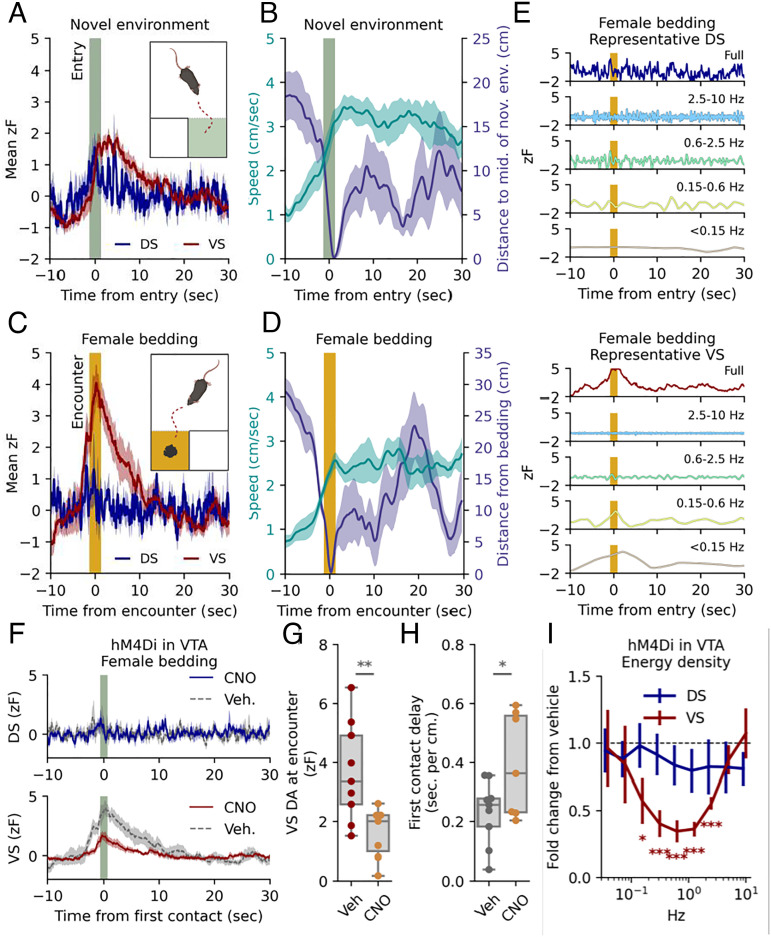
Fig. 2.
Exploration and reward-seeking behavior promotes ramp-like DA release in VS but not DS, which can be blunted by chemogenetic Gi-stimulation of VTA DA neurons. (A) Mean DA traces for right DS and left VS for TH-Cre mice expressing dLight1.3b in the right DS and left VS, and AAV-hSyn-DIO-hM4Di-mCherry in VTA. The traces are time-locked to entry into a novel chamber (t = 0, dark green band). The shaded area indicates SEM, n = 9 mice (two trials included for each mouse). (B) Mean speed (Left y-axis) and distance to middle of novel chamber (Right y-axis). Time-locked to entry (t = 0, dark green band). The shaded area indicates SEM, n = 9. (C) Mean fluorescent DA traces for right DS and left VS time-locked to first encounter with female-soiled bedding (t = 0, orange band). The shaded area indicates SEM, n= 9. (D) Mean speed (Left y-axis) and distance to female bedding (Right y-axis). Time-locked to first encounter (t = 0, orange band). The shaded area indicates SEM, n = 9. (E) DS (Top) and VS (Bottom) signals split into representative frequency domains isolated by multiresolution analysis of the maximal overlap discrete wavelet transform. Time-locked to first encounter with female-soiled bedding (t = 0, orange band). Colors match the corresponding domain in Fig. 1C. (F) Response to female bedding as in (C). after i.p. injection of either vehicle or 2 mg/kg CNO; DS (dark blue, Top) and VS (dark red, Bottom) signals are plotted for both vehicle (dashed line) and CNO (solid line). Shaded area indicates SEM, n = 9 for both groups). (G) Box plot of DA levels in VS at first encounter (**P = 0.009, unpaired student’s t test, n = 9). (H) Box plot of delay from gate removed to first encounter: unit is s/cm to account for differences in starting position for individual mice (*P = 0.04, unpaired Student’s t test, n = 9). (I) Change in spectral energy density from vehicle to CNO for minutes 15 to 30. Error bars indicate SEM, n = 9, Student’s t test, H0 = 1, FWER correction for all nine frequency bands with the Bonferroni–Holm method, *P < 0.05, ***, P < 0.001.

