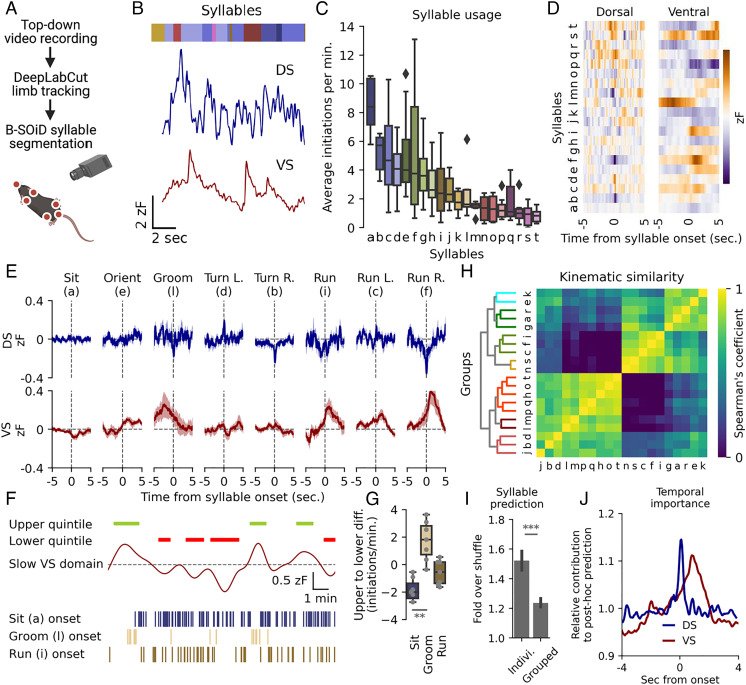
Fig. 3.
DS and VS DA dynamics correlate with movement across timescales. (A) Syllable identification pipeline. Mice were filmed from above, limbs tracked with DeepLabCut (43), and syllables segmented with an unsupervised clustering algorithm, B-SOiD (44). (B) Identified syllables (colored bar, each color representing a syllable) aligned to the DA signals in both regions. (C) Box plots of frequency of initiation for 20 most frequent syllables, n = 9. Syllables assigned letters in descending order. Black diamonds indicate outliers. (D) Average DA trace around onset in both DS and VS for each of the 20 most frequent syllables. (E) Fluorescent DA trace of DS (blue) and VS (red) around onset for eight humanly unambiguous syllables. The shaded area indicates SEM, n = 9. (F) Representative example showing frequency of sit (blue), groom (sand) and run (brown) correlated with slow DA oscillations in VS. Green bars indicate periods of upper quintile and red bars lower quintile. Syllable onsets are depicted with lines below. (G) Box plot of difference in frequency for upper and lower quintiles of slow VS levels (one-way ANOVA for all eight syllables in (E), F = 3.5, **P = 0.004. Post hoc Tukey HSD: sit = groom, **P = 0.01, n = 9, see SI AppendixFig. S6A for statistics all eight syllables). (H) Syllables hierarchically clustered by prediction certainty with the Spearman correlation coefficient and segmented into seven differently colored groups by arbitrary threshold (see SI AppendixFig. S5C for human annotations). (I) A random forest classifier correctly predicts individual syllables at a higher rate than kinematically grouped syllables when compared to shuffled guessing (fold over shuffle ± SEM, ***P = 5.2E-12, paired, two-tailed student’s t test, n = 9, 20 train-test iterations). (J) Relative contribution to classifier prediction by region (DS, blue. VS, red) around onset of syllables (n = 9, 20 train-test iterations).

