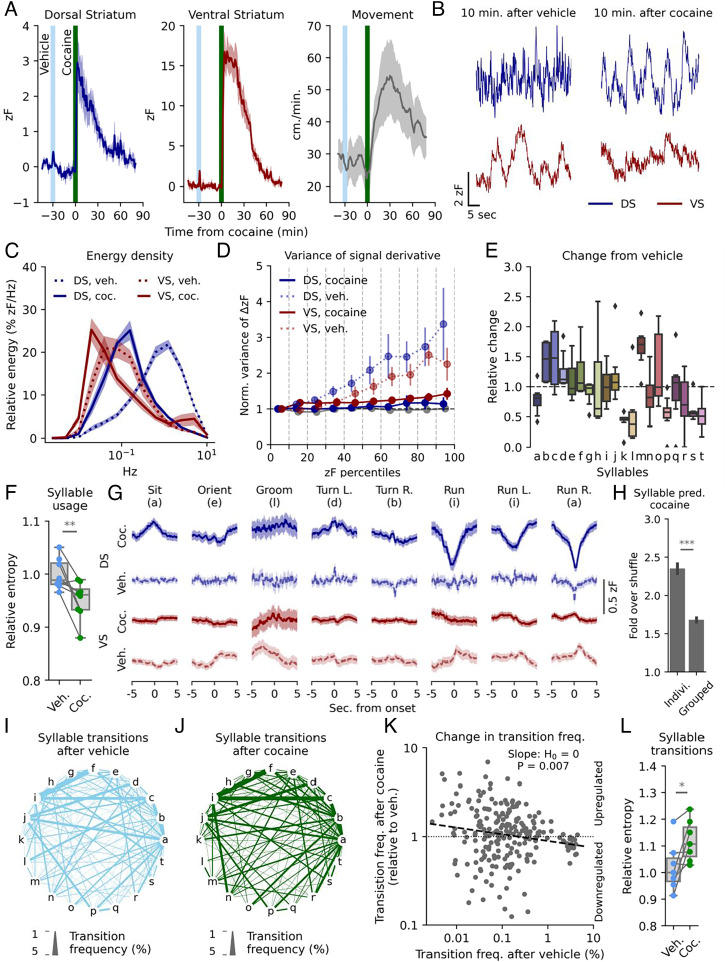
Fig. 4.
Cocaine alters rapid DA dynamics and ablates VS correlation to sub-second movements. (A) dLight1.3b expressing mice were habituated to an open arena for 15 min before receiving vehicle i.p., followed by 20 mg/kg cocaine after 30 min. The signal in DS (Left) and VS (Middle) and movement (Right) is plotted in 1-min bins. Shaded areas indicate SEM, n = 8 mice. (B) Representative traces of rapid dynamics in DS and VS 10 min. after vehicle (Left) and cocaine (Right). (C) Spectral energy density of DS and VS signal 10 to 20 min after vehicle (dashes lines) and cocaine (solid lines). Shaded areas indicate SEM, n = 8 mice. (D) Variance of the first-order derivative for each percentile bin normalized to bottom 10th percentile for simulated tonic release and DS and VS measurements. Error bars indicate SEM; no percentile survived multiple comparison with the Benjamini–Hochberg procedure (α = 0.05) after cocaine (Student’s t test, H0 = 1, n = 8). (E) Box plot of change in syllable frequency from vehicle to cocaine administration for the 20 most frequent syllables, n = 8 mice. (F) Entropy of syllable usage after vehicle (light blue) and cocaine (green). Normalized to vehicle mean (**P = 0.009, two-sided, paired Student’s t test, n = 8 mice). (G) Mean DA traces for DS (blue) and VS (red) after vehicle (dashed line) or cocaine (solid line) for eight selected syllables. Lines are averaged across mice with shaded areas indicating SEM, n = 8 mice. (H) A random forest classifier correctly predicts syllables 2 to 2.5 times as often as shuffled guessing and performs significantly better at individual syllables compared with kinematically similar groups (***P = 1E-21, paired, two-tailed Student’s t test). (I and J) State-transition plot of syllable transition frequency after vehicle (I) and cocaine (J) injection. Letters represent individual syllables with line thickness between the letters indicating transition frequency between the two syllables in absolute percentages. (K) Syllable transition frequencies after vehicle injection vs. transition frequency after cocaine relative to vehicle. The dashed line indicates least square linear fit (**P = 0.007, H0: slope = 0). (L) Entropy for the transition matrix (SI AppendixFig. S7E) after vehicle (light blue) and cocaine (green). Normalized to vehicle mean (*P = 0.015, one-sided, paired student’s t test, n = 8 mice).

