Fig. 5.
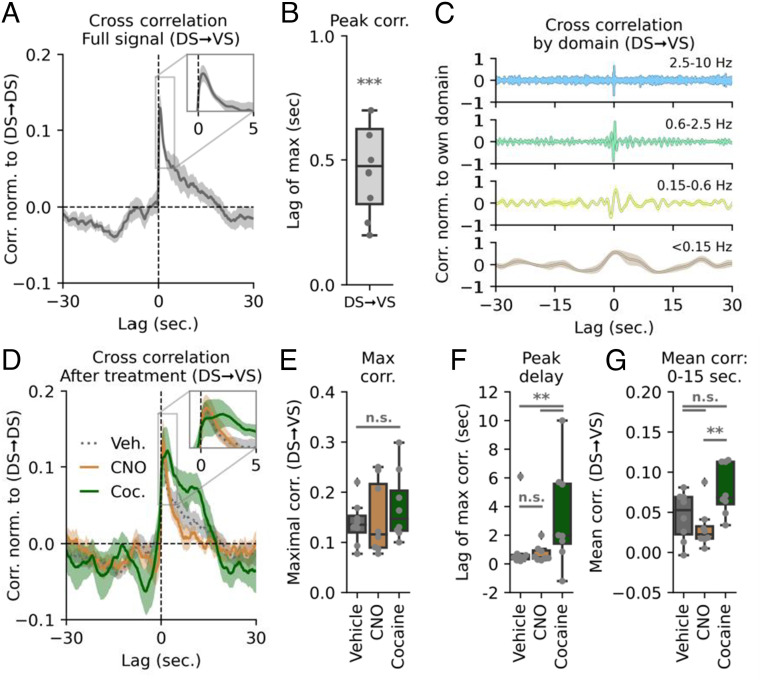
Cocaine alters cross-correlation of intrastriatal DA activity. (A) DS–VS cross-correlation normalized to DS auto-correlation. The Inset shows correlation peak and highlights that release in the DS is predictive of a subsequent VS release with approx. 0.5-s lag time. The shaded area indicates SEM, n = 8 mice. (B) Box plot of lag of maximal DS–VS cross-correlation (***P = 4.4E-5, one-sample Student’s t test, n = 8 mice). (C) DS–VS cross-correlation by different frequency bands. Each domain is normalized to self within each mouse. Colors correspond to frequency domains in Fig. 1C. (D) DS–VS cross-correlation for vehicle (dashed gray line), CNO (solid orange), and cocaine (solid green). Shaded area indicates SEM, n = 8 mice for all three groups. (E) Maximal cross-correlation remains unchanged (one-way ANOVA: F = 0.58, P = 0.57, n = 8). All treatments normalized to DS auto-correlation. (F) Box plot of distribution of max lag in DS–VS cross-correlation for vehicle, CNO, and cocaine. Only cocaine significantly alters correlation timing (veh.:CNO, P = 0.16; veh.:cocaine, **P = 0.002; CNO:cocaine, **P = 0.004, Levene variance test, FWER correction with Bonferroni–Holm, n = 8 mice). (G) Quantification of mean cross-correlation from 0 to 15 s. VS lag. Vehicle is not significantly different from the two treatments, but CNO and cocaine differs (one-way ANOVA: F = 7.56, P = 0.0059, n = 8; Tukey HSD: veh.:CNO, P = 0.58; veh.:cocaine, P = 0.09; CNO:cocaine, **P = 0.01).

