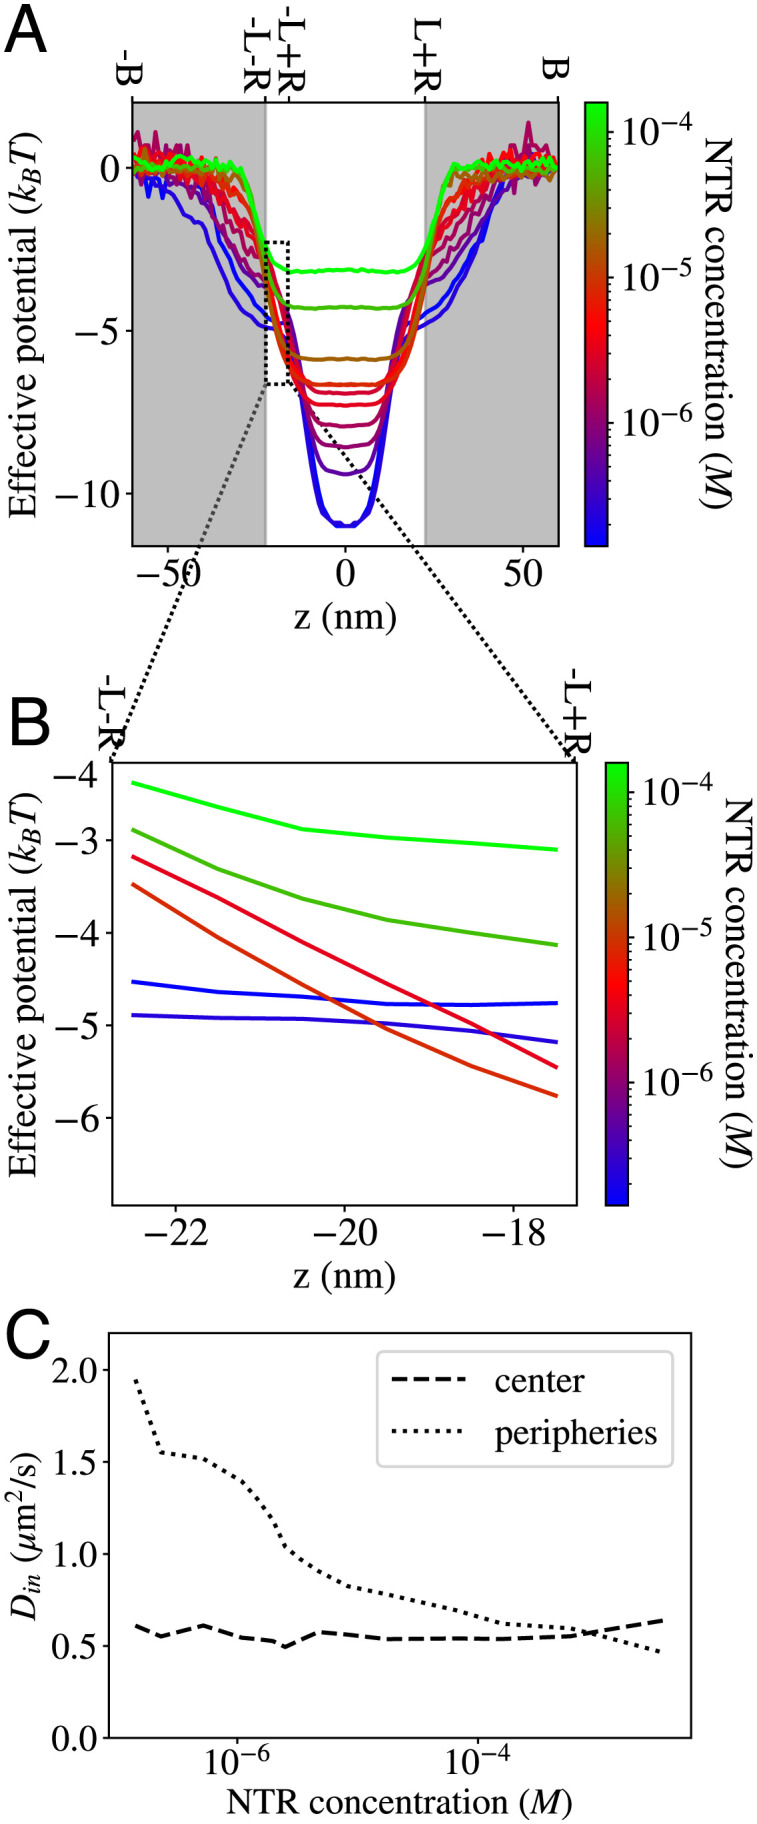
Fig. 3.

The effects of increased crowding on the effective potential and the diffusion coefficient in the pore. (A) Effective potentials measured within the simulation box. The white background indicates the region where an NTR is considered to be within the pore (for the purpose of classifying abortive and entry events). How effective potentials are measured in the presence of crowding is depicted in SI Appendix, Section SC. (B) Zoomed-in effective potentials for representative NTR concentrations in the region from z = −L − R to z = −L + R (the bounds of the integral in the numerator of Eq. 3). (C) Effective diffusion coefficients of NTRs in the central (z ∈ (− 6.2, 6.2) nm) and peripheral regions (z ∈ (− 20, −6.2) nm ∪ (6.2, 20) nm) as functions of the NTR concentration (SI Appendix, Fig. S7A).
