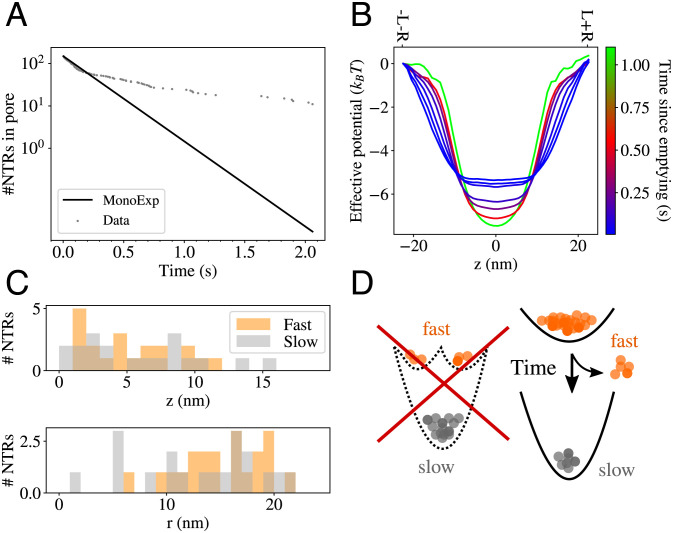
Fig. 7.
Analysis of the biphasic escape from the pore. (A) Gray dots indicate the number of NTRs remaining inside the pore at various times throughout our simulation. While the majority of the NTRs escaped within 0.1 s, the pore was still populated by NTRs after 2 s. The black line is a single-exponential fit to the early “fast” phase of the decay process. (B) The effective potential experienced by the NTRs inside the pore deepens as more NTRs escape due to competition-induced release, therefore increasing the dwell times as the pore empties. (C) Comparison of the initial t = 0 locations within the pore of the first 20 (“fast”) and the last 20 (“slow”) NTRs to leave the pore during the decay process (indicated in orange and gray colors, respectively). (Top): Initial position along the axial z coordinate. (Bottom): Initial position along the radial r coordinate. (D) The average effective potential could be experienced by all NTRs, or it could be a composite of separate shallow and deep potentials (Left), producing distinct fast and slow NTR populations. The results of our analysis are consistent with the scenario where the average potential is experienced by all NTRs (right), and fast and slow NTR populations are not distinct, but formed dynamically as the NTR population within the pore decays.

