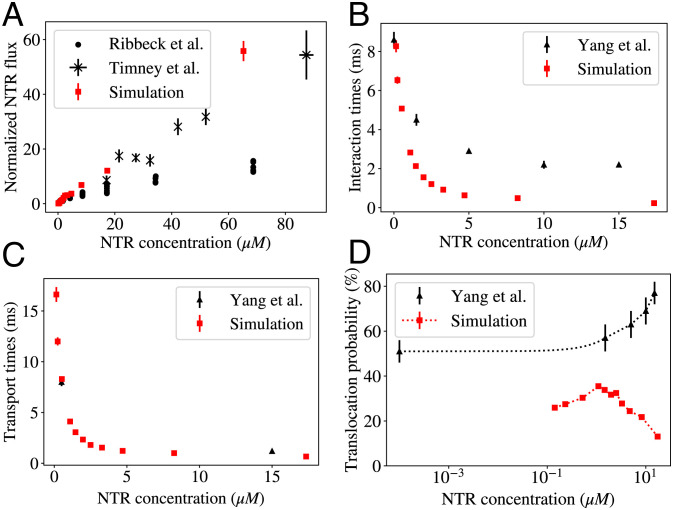
Fig. 8.
Direct comparison of our simulation results with past experimental results. (A) Flux into the nucleus (normalized by the respective values at 1 μM NTR concentration in the cytoplasm) measured from our simulations (red) and datasets adapted from refs. (31) and (32) (black). (B–D) Interaction times, transport times, and translocation probabilities (SI Appendix, Text for definitions) measured from our simulations (red), compared with data from (27) (black). We note with respect to panel D that as our simulations contained no energy input, the translocation probabilities that we measure have a thermodynamic upper bound of 50%, whereas this upper bound does not apply in cells where RanGTP is present (36, 58).

