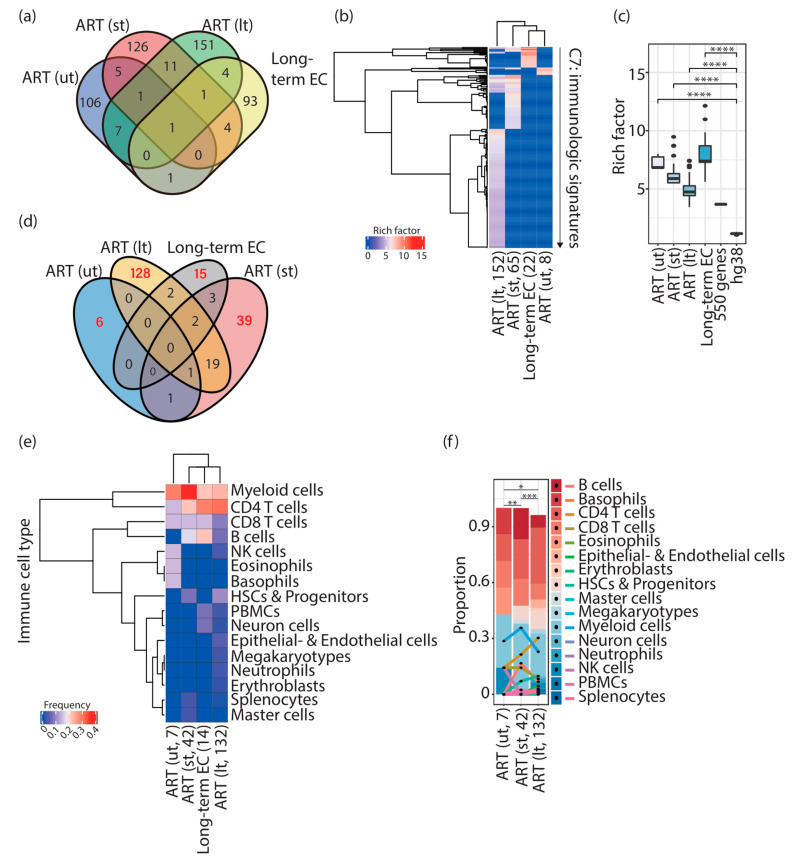
Figure 1.
Distinct immunologic signatures were enriched in HIV-1-infected individuals and elite controllers. (a) Venn diagram representing the overlap of input genes in HIV-1-infected individuals and elite controllers. Genes shared among different groups of input genes are listed in Table S27. (b) Cluster heatmap representing immunologic signatures enriched in HIV-1-infected individuals and elite controllers. Parentheses placed under the column indicate the status of ART (“lt” refers to HIV-1-infected individuals subjected to a long period of ART; “st” refers to HIV-1-infected individuals subjected to a short period of ART; “ut” refers to pretreatment HIV-1-infected individuals) followed by the quantity of enriched immunologic signatures. The color scale represents the magnitude of the enrichment represented by rich factors. (c) Box plots representing the enrichment of immunologic signatures represented by rich factors. Commands executed to calculate rich factors are described in the Materials and Methods. Statistical significance was calculated using the Wilcoxon test in R with default options. (d) Venn diagram representing the overlap of enriched immunologic signatures in HIV-1-infected individuals and elite controllers. Red numbers indicate the quantity of unique enriched immunologic signatures. (e) Cluster heatmap representing the frequency of immune cell types present in unique enriched immunologic signatures in HIV-1-infected individuals and elite controllers. Parentheses placed under the column indicate the number of immune cell types counted in the enriched immunologic signatures. (f) Stacked bar chart representing the proportion of the different compositions of immune cell types in pretreatment HIV-1-infected individuals and patients receiving ART. Parentheses placed under the column indicate the number of immune cell types counted in the enriched immunologic signatures. Statistical significance was calculated using Pearson’s chi-square test in R with default options, * p ≤ 0.05, ** p ≤ 0.01, *** p ≤ 0.001, **** p ≤ 0.0001. ART; antiretroviral therapy. EC; elite controllers. HSCs; hematopoietic stem cells. NK cells; natural killer cells. PBMCs; peripheral blood mononuclear cells.

