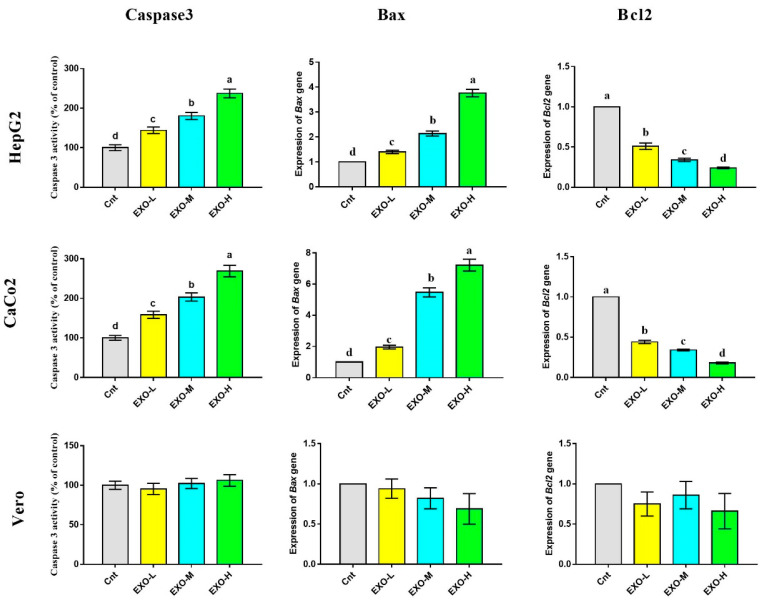
Figure 5.
Effect of CM-EXOs on activities of caspase 3 and expression of Bax and Bcl2 as detected by ELISA and qPCR, respectively. Values are expressed as fold change mean ± SEM (n = 3/group). Columns with different letters are significantly different at p < 0.05. All groups were compared to each other. Cnt, control cells; EXO-L, cells treated with low dose of EXOs; EXO-M, cells treated with medium dose of EXOs, and EXO-H, cells treated with high dose of EXOs.

