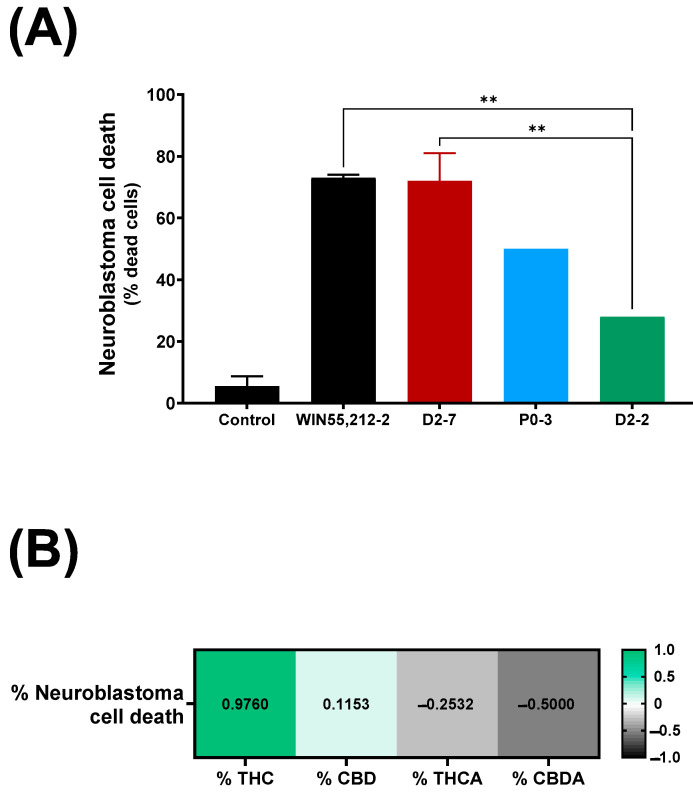
Figure 2.
(A) Neuroblastoma cell death upon exposure to different Cannabis plant extracts (final concentration of each plant extract was 3.5 μg/mL), in control situation and exposed to WIN55,212-2 synthetic cannabinoid (3.5 μg/mL). Each condition was analyzed per duplicate. A one-way ANOVA with Tukey’s post-hoc was performed, with α set as 0.05, two-tailed. p-value < 0.01 (**). (B) Pearson correlation between neuroblastoma cell death expressed as percentage, and quantity of tetrahydrocannabinol, cannabidiol, tetrahydrocannabinol A (THCA), and cannabidiol A (CBDA), expressed as percentage.

