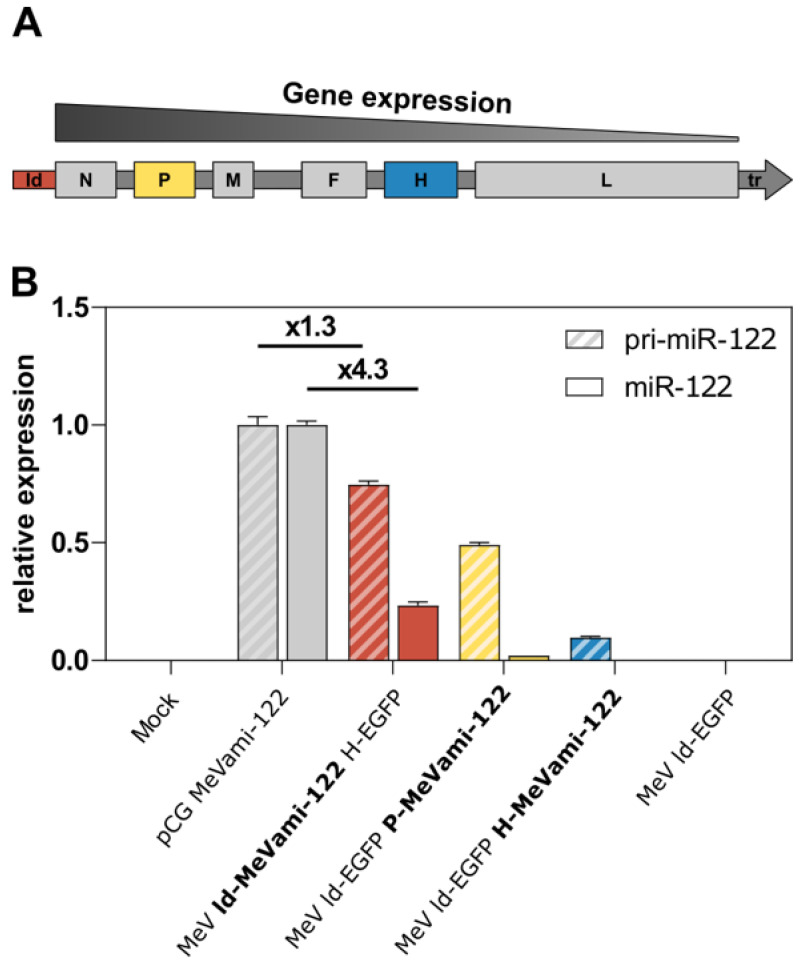
Figure 3.
Transcriptional gradient and differential expression of (pri-)miR-122. (A) Schematic depiction of MeV genome with indicated gene expression gradient. Genes further upstream in the genome are transcribed more frequently. (B) Relative expression of pri-miR-122 and mature miR-122 in cells transfected or infected with MeVami-122-encoding vectors. Vero cells were either infected with recombinant, MeVami-122-encoding MeV at an MOI of 0.3 or transfected with 0.5 μg/mL pCG MeVami-122 and harvested 30 h p.i./p.t. Results of qPCR analysis are depicted as viral pri-miR-122/mature miR-122 expression relative to pri-miR-122/mature miR-122 expression, respectively, in transfected cells (pCG MeVami-122).

