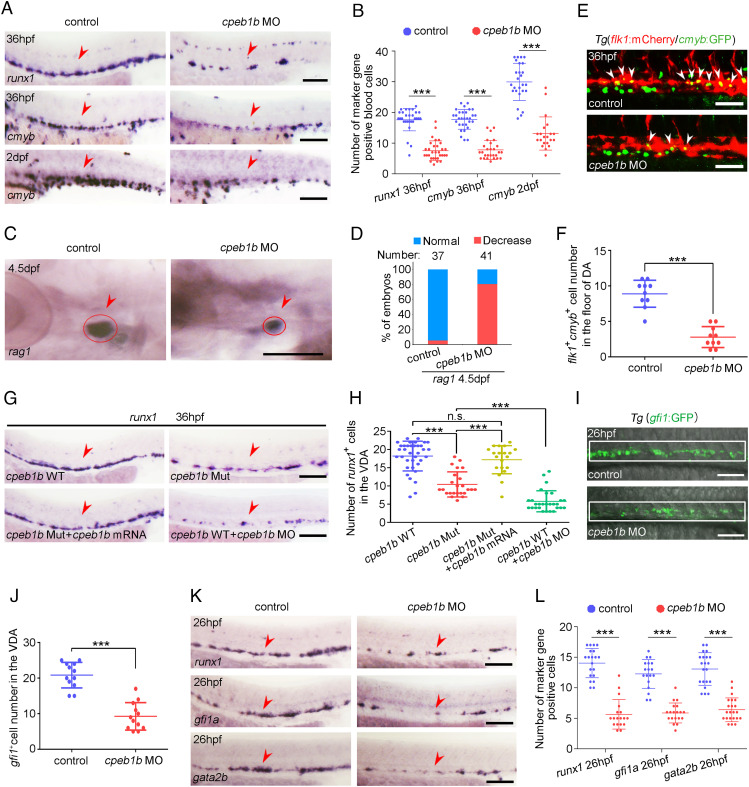
Fig. 1.
Cpeb1b deficiency impairs HSPC production. (A) Examination of the expression of runx1 and cmyb in the control and cpeb1b morphants by WISH. The red arrowheads denote HSPCs. (Scale bar, 100 μm.) (B) Statistical analysis of the WISH. Error bar, mean ± SD, ***P < 0.001. (C) Examination of the rag1 expression in the control and cpeb1b morphants by WISH. (D) Quantification of the WISH. (E) Confocal imaging shows the flk1+cmyb+ definitive hematopoietic precursors in the VDA region of control and cpeb1b morphants at 36 hpf. White arrowheads denote flk1+cmyb+ precursors. (Scale bars, 100 μm.) (F) Statistical analysis of flk1+cmyb+ definitive hematopoietic precursors. Error bar, mean ± SD. The P value was calculated by Student’s t test, ***P < 0.001. (G) Examination of the runx1 expression in WT, cpeb1b mutant, cpeb1b mRNA-overexpressed cpeb1b mutant, and cpeb1b MO-injected WT embryos by WISH. In WISH experiments using cpeb1b mutant embryos, the embryos were obtained by cross-mating cpeb1b adult mutants and individually subjected to genotyping after WISH for identifying homozygous mutants. (Scale bar, 100 μm.) (H) Statistical analysis of the WISH. Error bar, mean ± SD, n.s.: no significance, ***P < 0.001. (I) Confocal imaging shows the gfi1+ HE cells in the VDA region of control and cpeb1b morphants at 26 hpf. (Scale bars, 100 μm.) (J) Statistical analysis of gfi1+ HE cells. Error bar, mean ± SD. The P value was calculated by Student’s t test, ***P < 0.001. (K) Examination of the HE marker runx1, gfi1a, and gata2b expression in control and cpeb1b morphants at 26 hpf by WISH. (Scale bars, 100 μm.) (L) Statistical analysis of the WISH. Error bar, mean ± SD, ***P < 0.001.

