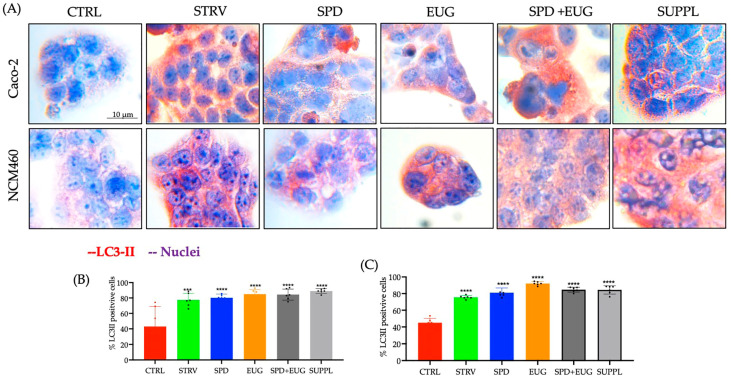
Figure 2.
The effect of 1.2 µM spermidine (SPD) and 0.2 mM eugenol (EUG) alone, in combination (1.2 µM SPD + 0.2 mM EUG), and in supplement (SUPPL) form (1.2 µM SPD + 92 µM EUG), respectively, on LC3-II activation in Caco-2 (A,B) and NCM460 (A,C) cell lines compared to the untreated control (CTRL). (A–C) LC3-II expression in the CTRL, the starvation (STRV)-induced control, and all treatments was detected with red chromogen staining after 4 h and visualized at ×40 magnification. (B,C) Statistical analysis of the LC3-II positive cells stained with red chromogen was performed with significant differences represented as follows: *** 0.0001 < p < 0.001, **** p < 0.0001. The black dots indicate the positioning of the individual replicates within the bar for each sample.

