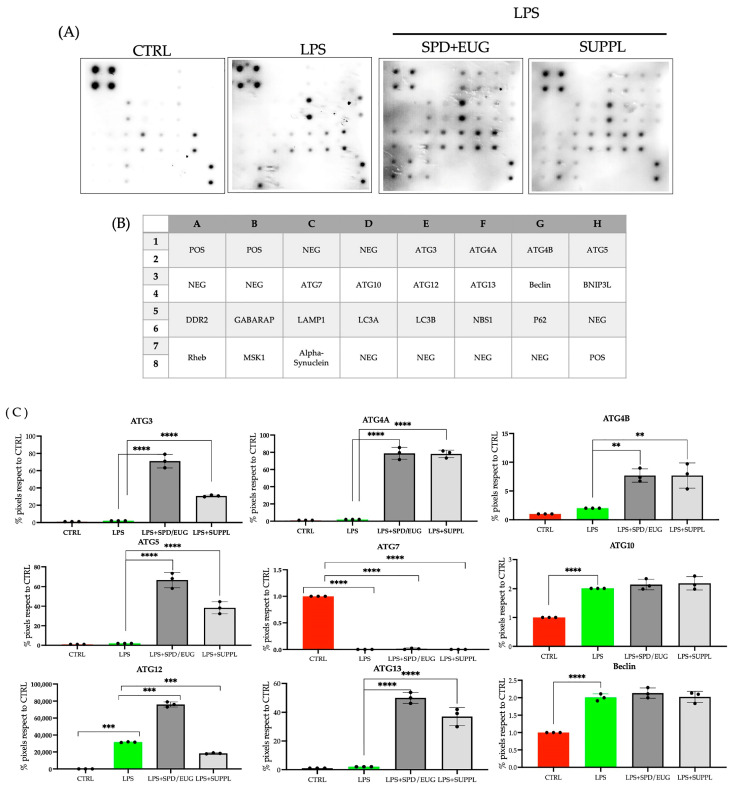
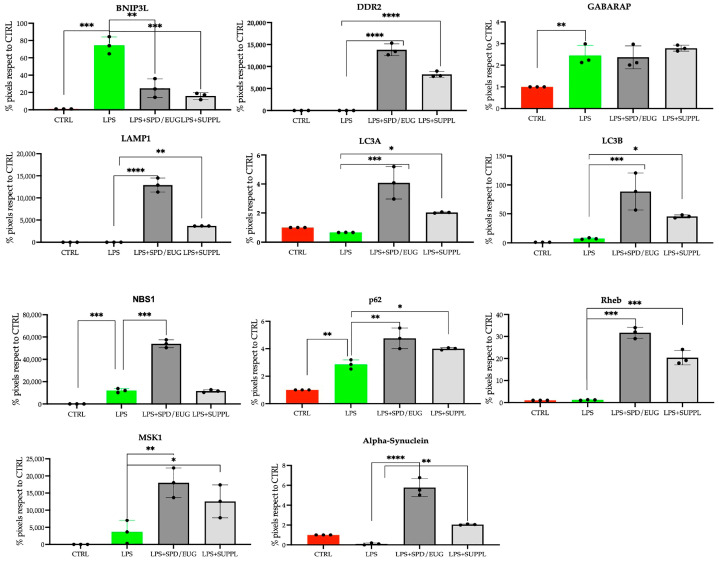
Figure 5.
Expression (A) of 20 individual human autophagy proteins in NCM460 cells, identified according to the (B) position location on the micro-array. Protein expression (A) was performed in the untreated control (CTRL) and lipopolysaccharide (LPS)-treated cells (1 ng/mL LPS) after 24 h and compared to cells pre-incubated for 1 h with 1.2 µM spermidine (SPD) + 0.2 mM eugenol (EUG) and in supplement (SUPPL) form (1.2 µM SPD + 92 µM EUG) prior to LPS addition. (C) Protein expression for each of the 20 proteins was quantified for each treatment. Significant differences were represented as follows: * 0.01 < p < 0.05, ** 0.001 < p < 0.01, *** 0.0001 < p < 0.001, **** p < 0.0001. The black dots indicate the positioning of the individual replicates within the bar for each sample.


