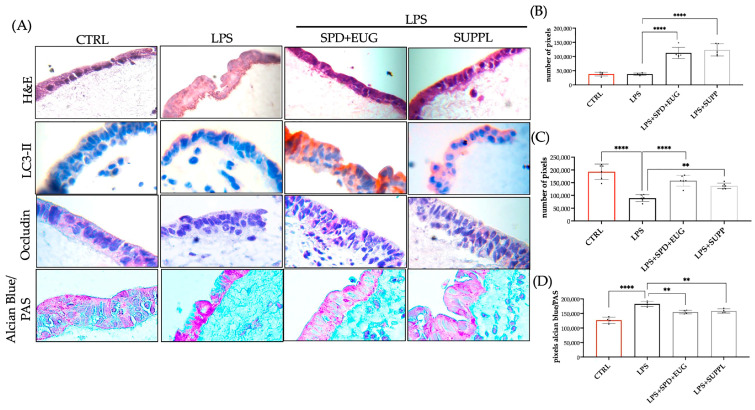
Figure 7.
(A) Hematoxylin and eosin (H&E) staining, and LC3-II, occludin, and mucus expression of 3D intestinal equivalents (Caco-2/U937/L929 co-cultures) exposed to a 24 h pretreatment of either 1.2 spermidine (SPD) and 0.2 mM eugenol (EUG) or supplement (1.2 µM SPD + 92 µM EUG) prior to the addition of lipopolysaccharide (LPS, 1 ng/mL) for a further 24 h compared to the untreated control (CTRL) and LPS treatments alone. The magnification was ×60. (B) Quantification of LC3-II-red chromogen staining, (C) occludin–red chromogen staining (D) mucus expression from Alcian Blue/Periodic Acid-Schiff Stain (PAS) staining of the Caco-2 cells. Significant differences were represented as follows: ** 0.001 < p < 0.01, **** p < 0.0001. The black dots indicate the positioning of the individual replicates within the bar for each sample.

