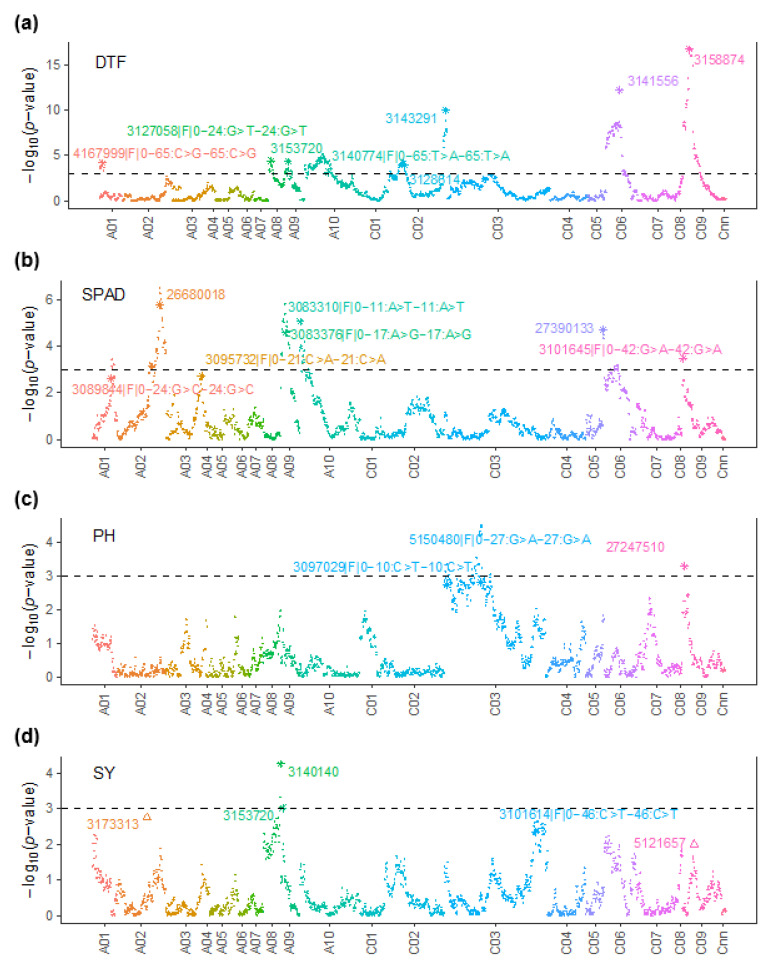
Figure 4.
Manhattan plots showing genomic regions associated with (a) DTF: Days to flower; (b) SPAD: Chlorophyll content; (c) PH: Plant height; and (d) SY: Seed yield, in the DH population. The QTL for main effects are depicted by ‘*’, and the QTL by Environment interactions are depicted by ‘Δ’. The LOD (-log10p-value) scores presented in the Manhattan plot are from the genome scan for the QTL main effects where the LOD scores of the significant QTL are replaced with the values from the final model. The black dashed line indicates the threshold value for significant SNPs at LOD ≥ 3. The physical positions of DArTseq markers (x-axis) are based on the map position on the Darmor-bzh genome assembly (for detail, see Supplementary Table S2).

