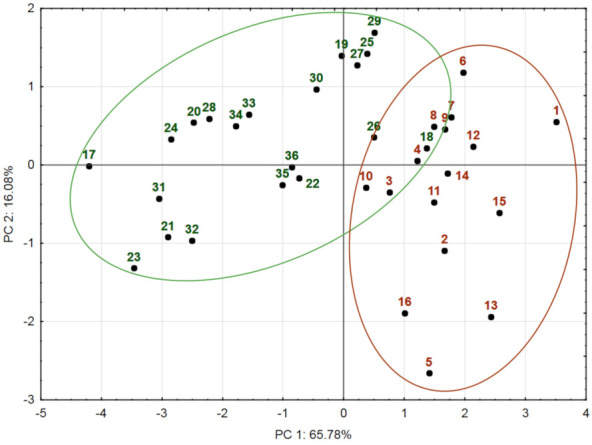
Figure 2.

PCA2 score plot model representing the accumulation of total phenolic acids and flavonoids in Achillea millefolium plant materials from Turkish (No. 1–16) and Lithuanian (No. 17–36) populations. Inflorescence, leaf, and stem datasets were pooled together and used for PCA2. Scores marked in brown indicate Turkish populations; scores marked in green indicate Lithuanian populations.
