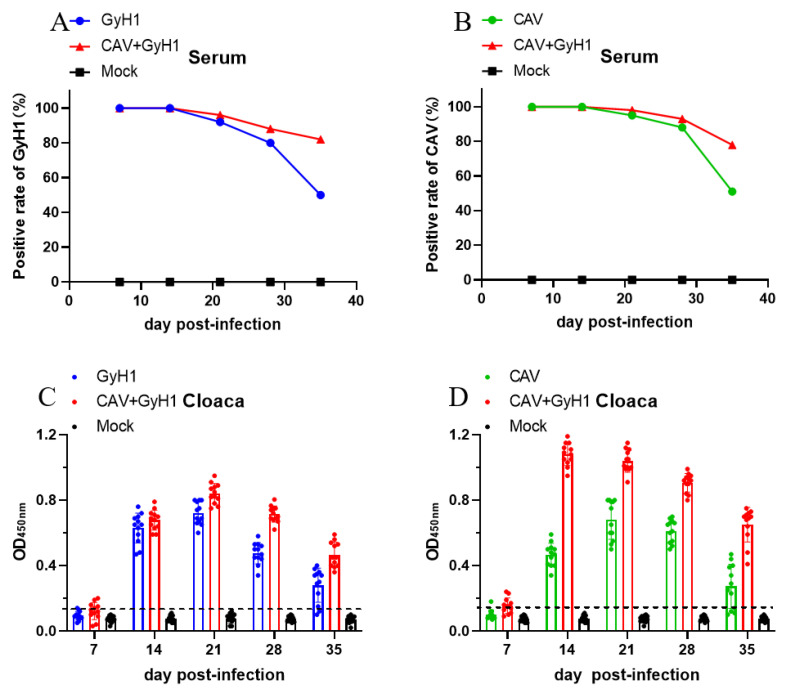
Figure 2.
Dynamic changes of positive viremia rate and virus shedding. (A) Comparison of the GyH1 viral positive rates in serum in Mock, GyH1, and co-infected chickens at different time points, determined by DAS-ELISA. (B) Comparison of the CAV viral positive rates in serum from chickens in Mock, CAV, and co-infected chickens at different time points, determined by ELISA. (C) Comparison of VP1 antigen levels of GyH1 in cloacal swabs in Mock, GyH1, and co-infected chickens at different time-points, determined by DAS-ELISA. (D) Comparison of VP1 antigen levels of CAV in cloacal swab Mock, GyH1, and co-infected chickens at different time-points, determined by ELISA.

