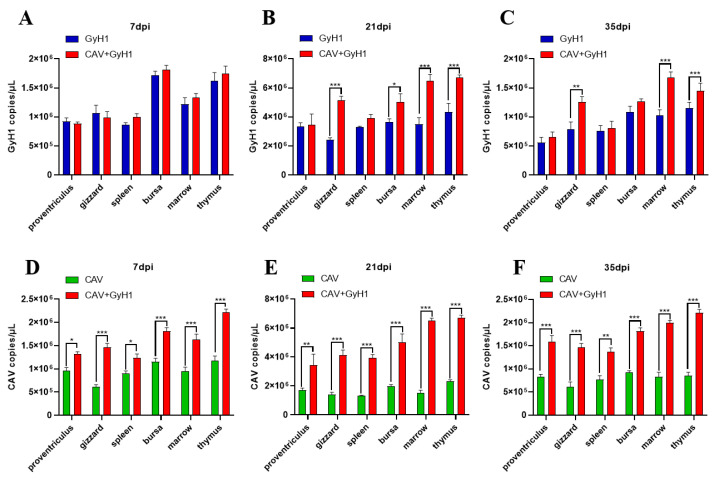
Figure 5.
Comparison and dynamic changes of viral loads in infected chicken tissues. (A–C) Comparison of organ GyH1 viral loads between the GyH1- and co-infected chickens, determined by qPCR. (D–F) Comparison of organ CAV viral loads in CAV- and co-infected chickens, determined by qPCR. * , p < 0.05; ** , p < 0.01; *** , p < 0.001, (Student’s t-tests).

