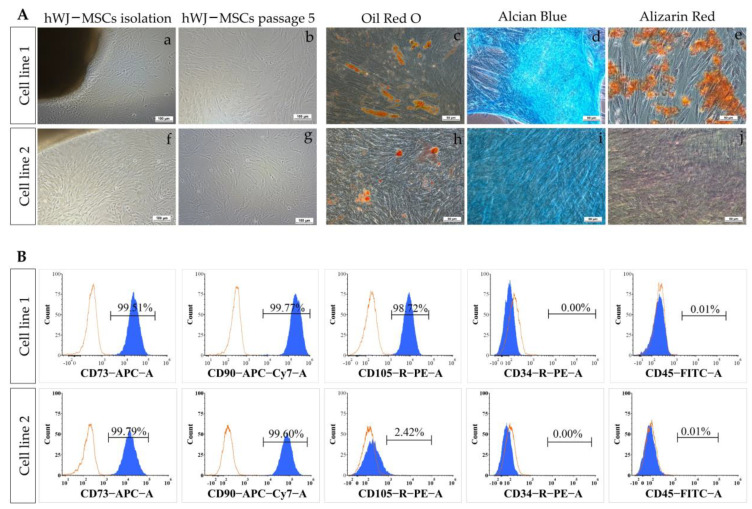
Figure 1.
MSCs characterization. (A) Phase contrast images of MSCs expanded from Wharton’s Jelly tissue (a,f) and 80% confluences (b,g) of cell lines 1 and 2, scale bar = 100 µm. Trilineage differentiation ability of MSCs after 21 days (c–e, h–j), evaluated by Alizarin Red (osteogenic), Alcian Blue (chondrogenic), and Oil Red O (adipogenic) staining; scale bar = 50 µm. (B) Cell surface marker expression analysis of MSCs. MSCs of cell lines 1 and 2 were analyzed by flow cytometry with CD73+, CD90+, CD105+, CD34-, and CD45- cell surface markers.

