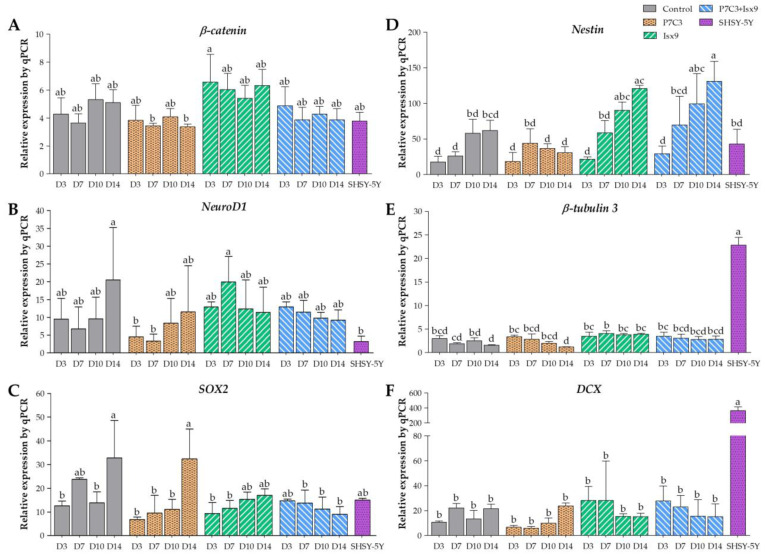
Figure 9.
Gene expression analysis of NSs by qPCR, (A) β-catenin, (B) NeuroD1 (C) SOX2, (D) Nestin, (E) β-tubulin 3, and (F) DCX genes. The target gene was normalized to β-actin as a reference gene and calculated the relative expression compared with each group. Data were shown as mean ± S.D. with different lower-case letters, and are significantly different at p < 0.05.

