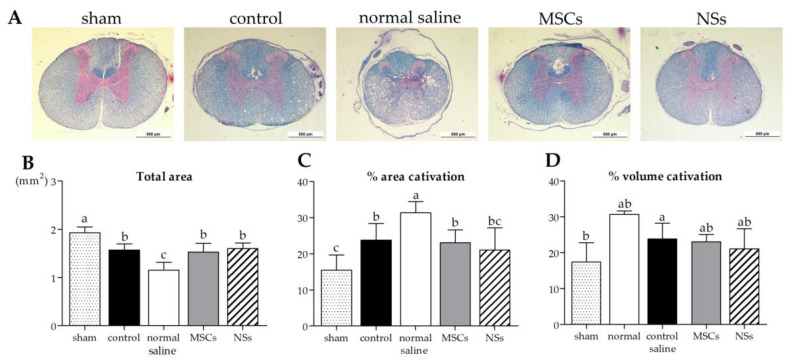
Figure 15.
LFB/H&E staining of spinal cord tissue analysis. (A) Images of spinal cord tissue stained with LFB/H&E, scale bar = 500 µm. The results of cavitation analysis from LFB/H&E staining of spinal cord injury tissue, (B) total area of the spinal cord (mm2), (C) percentage of area cavitation, and (D) volume cavitation were shown. Data were shown as mean ± S.D. with different lower-case letters, and are significantly different at p < 0.05.

