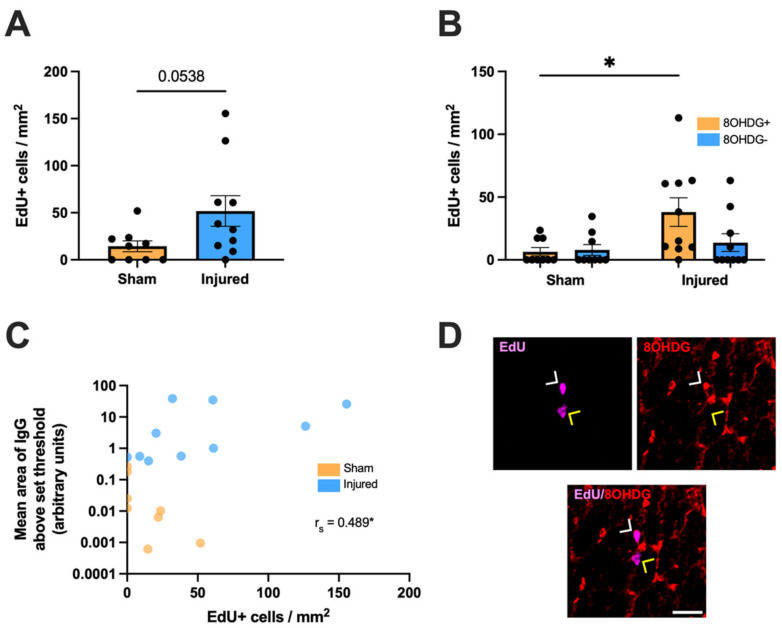
Figure 2.
Effect of injury on cellular proliferation within the ventral optic nerve. (A) The density of EdU+ cells was quantified in the ventral optic nerve following partial optic nerve transection or sham injury. Graphs display individual data points overlaid on a bar displaying the mean ± SEM. n = 9–10 rats per group. Statistical analysis by t-test. (B) The relative densities of EdU+ 8OHDG+ and EdU+ 8OHDG− cells were quantified. Statistical analysis by two-way ANOVA and Tukey post-hoc tests. Graphs display individual data points overlaid on a bar displaying the mean ± SEM. n = 9–10 rats per group. (C) The area of IgG immunointensity was correlated to the density of EdU+ cells using Spearman’s correlation, with the rs value and corresponding p-value displayed on the graph. The mean area of IgG immunointensity was plotted on a log scale to best illustrate the overall relationship between IgG and EdU on the scatterplot. Each data point on the graph represents an individual animal. n = 8–10 rats per group. (D) Representative image of both an EdU+ 8OHDG+ cell (white arrow head) and an EdU+ 8OHDG− cell (yellow arrow head) is shown, scale bar = 25 μm. No outliers were removed for any outcome measure. Significant differences are indicated by * p ≤ 0.05.

