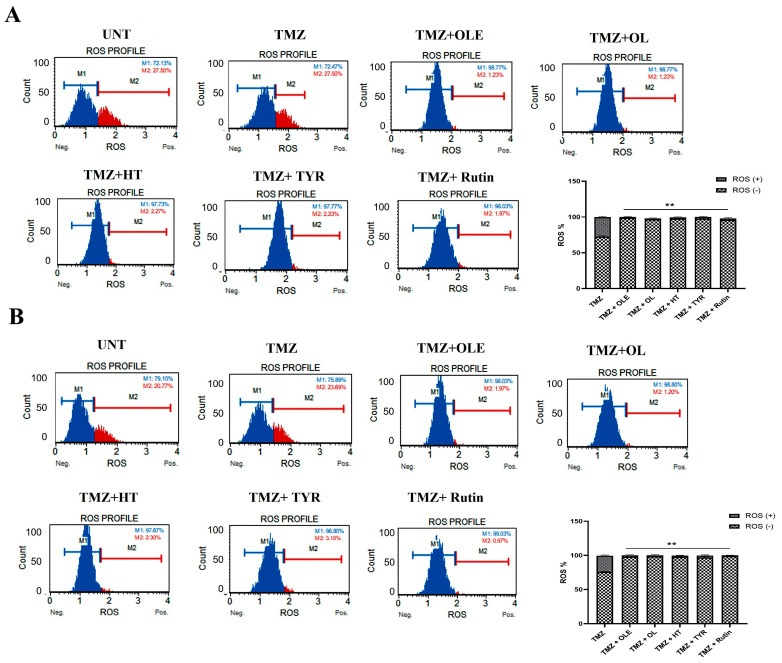
Figure 14.
ROS levels in (A) T98G and (B) A172 cells treated with TMZ−only, TMZ + OLE, and TMZ + OLE phenolics. Data are presented as the mean ± SD. p-value was calculated as compared to TMZ-only treated cells using a two-way ANOVA test (n = 3). ** p < 0.0001. M1: ROS (−), M2: ROS (+). UNT: untreated, TMZ: temozolomide, OLE: Olea europaea leaf extract, OL: oleuropein, HT: hydroxytyrosol, TYR: tyrosol.

