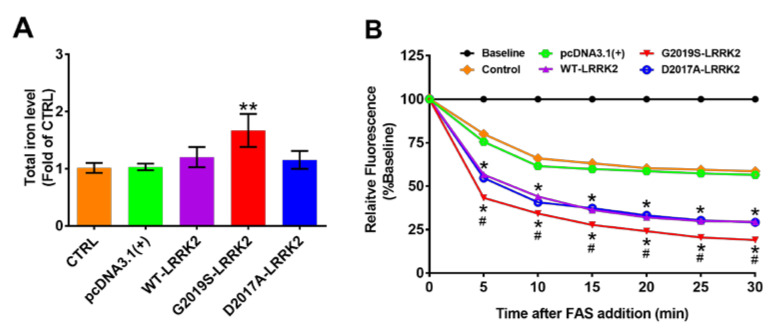
Figure 5.
G2019S-LRRK2 increases total iron content and ferrous iron uptake. (A) The intracellular total iron content was measured by reacting with Ferene S after ferric reduction to ferrous (n = 3). ** p < 0.001 versus the pcDNA3.1(+) vector. (B) The ferrous iron uptake was investigated by Calcein-AM. After the initial baseline of fluorescence intensity was collected at 488 nm for excitation and 525 nm for emission wavelengths, ferrous ammonium sulfate (FAS; 40 µM of final concentration) was added to the cuvette. The quenching of calcein fluorescence was recorded every 5 min for 30 min (n = 3). * p < 0.001 versus the pcDNA3.1(+) vector, # p < 0.001 versus WT-LRRK2 at each time.

