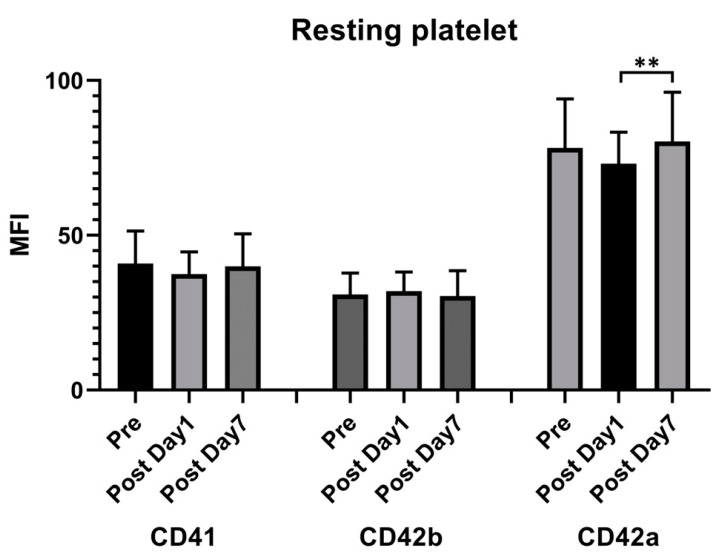
Figure 2.
Resting platelet surface receptor expression following the ChAdOx1 nCoV-19 vaccine. Flow cytometry was used to measure the time course of the platelet surface expressions of CD42b, CD42a, and CD41. The presented values are the median fluorescence intensity (MFI) ± standard deviation. ** p < 0.01.

