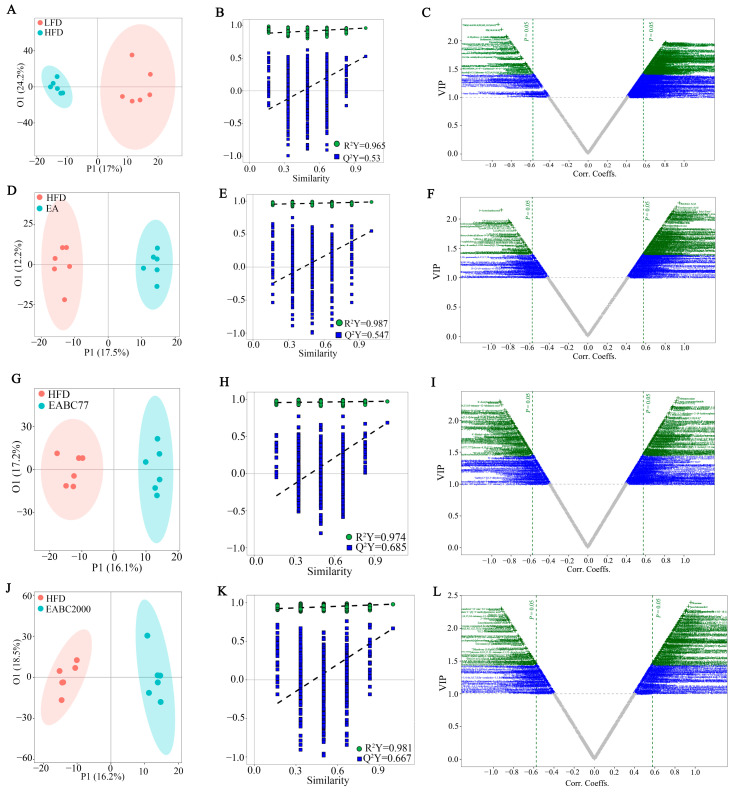
Figure 4.
Untargeted metabolomic analysis of mouse plasma metabolites by UPLC-QTOF MS/MS. OPLS-DA score plot (A: R2Y = 0.965, Q2Y = 0.53; D: R2Y = 0.987, Q2Y = 0.547; G: R2Y = 0.974, Q2Y = 0.685; J: R2Y = 0.981, Q2Y = 0.667), the corresponding permutation plots (B,E,H,K), and v-plot (C,F,I,L). LFD: low-fat-diet group; HFD: high-fat-diet group; EA: ellagic acid intervention group; EABC77: EA + Weizmannia coagulans BC77 intervention group; EABC2000: EA + Weizmannia coagulans BC2000 intervention group.

