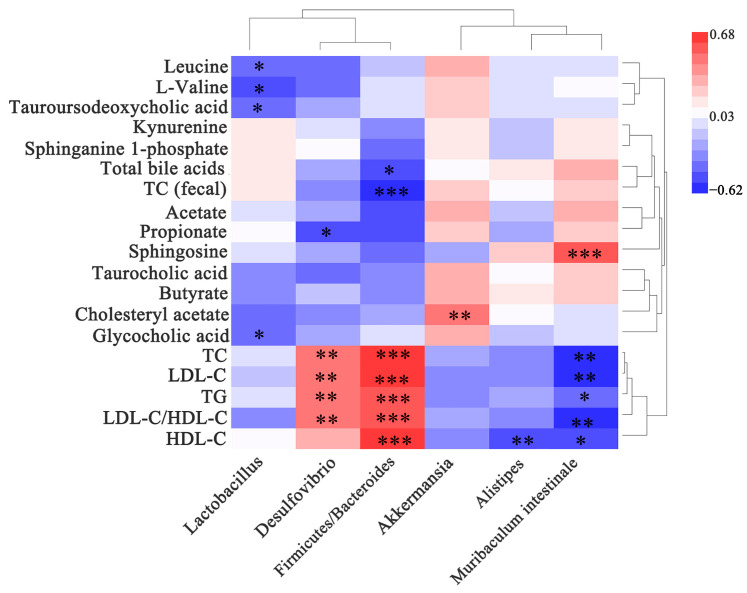
Figure 6.
Heat map of the correlation between biochemical indicators and metabolites with gut microbiota. The x-axis of the heat map represents the gut microbiota. The y-axis represents the biochemical indicators and metabolites. The R and p values were calculated, and the R values are shown in different colors. The color card on the right shows the range of colors for the different R values. The symbol “*” indicates a significant correlation at the 0.05 level; the symbol “**” indicates a significant correlation at the 0.01 level; the symbol “***” indicates a significant correlation at the 0.001 level. The top clusters represent the clustering of gut microbiota, and the right-side clusters represent the clustering of biochemical indicators and metabolites.

