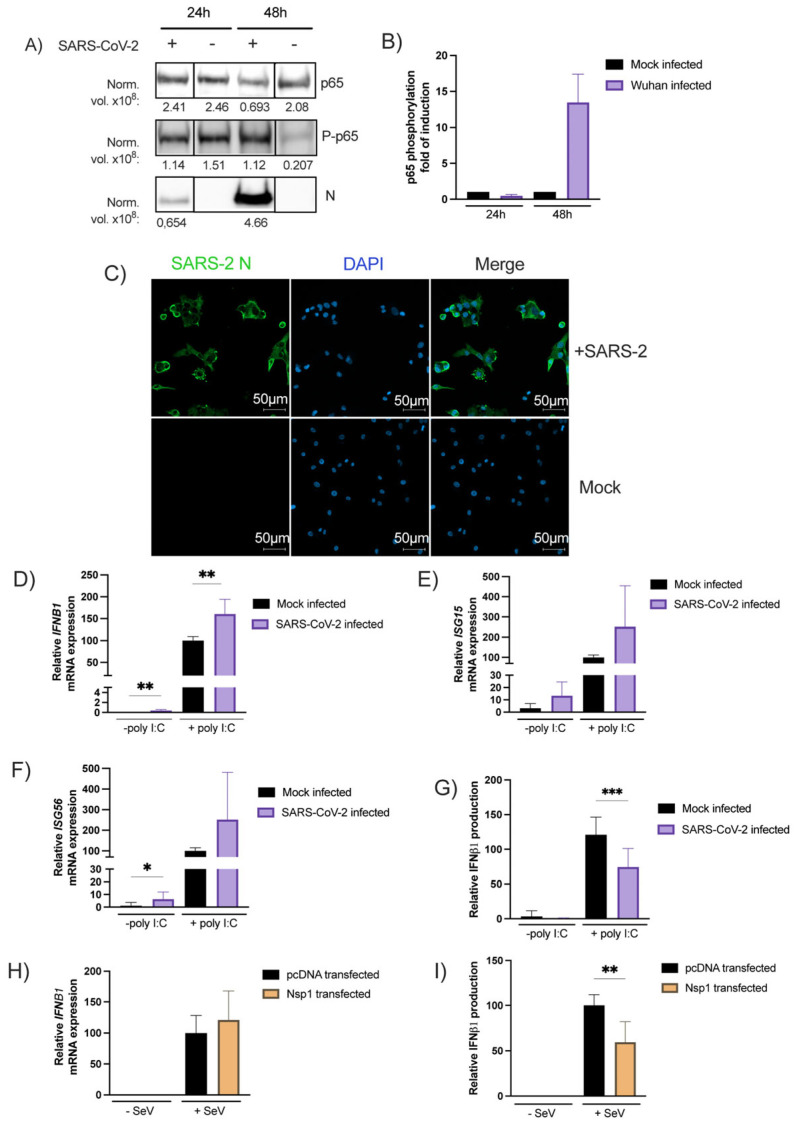
Figure 3.
The NF-κB p65 subunit expression and phosphorylation following infection with the SARS-CoV-2 (A,B). A549-hACE2 cells in 6-well plate infected as described in the method section. Then, harvest RIPA buffer with Halt Phosphatase Inhibitor Cocktail detected by Western Blot with anti-p65, anti-P-p65 or anti-SARS-CoV-2-N and Stain-Free Imaging Technology® as loading control (Supplementary Figure S1) and expressed as normalized levels (Norm. vol. ×108) below the blot. Then, NF-κB p65 phosphorylation is normalized with p65 subunit expression and expressed as fold of induction relative to the mock-infected control (mean ± SD, n = 2 replicates/condition) (B). SARS-CoV-2 Nucleocapsid staining on A549-hACE2 infected cells. Forty-eight hours post-infection cells were fixed and stained as described in the materials and methods section. This staining was performed a least three times and a representative picture was shown. (C). Effect of SARS-CoV-2 infection on poly(I:C) IFNB1 mRNA expression (D), ISG15 mRNA (E) or ISG56 mRNA expression (F), induced IFNβ1 production (G). Twenty-four hours post-seeding, A549-hACE2 cells were infected with SARS-CoV-2 as described in the materials and methods section. Thirty-two hours post-infection, SARS-CoV-2 and mock-infected cells were stimulated with poly(I:C) and RNA extracted and analyzed with RT-qPCR while IFNβ1 was measured in the supernatant by ELISA. Effect of Nsp1 on IFNb1 mRNA (H) and protein (I) expression. Cells were transfected with expression vectors Nsp1 or an empty vector and infected or not with SeV as IFNβ inducer. RNA was isolated and analyzed for IFNB1 mRNA (H), Supernatants were collected and assayed for IFNβ production (I). All experiments were performed twice in triplicate and the compilation of the data is shown. Results are expressed as activation percentage relative to the poly I:C transfected or SeV-infected negative control (mean ± SD (n = 6 replicates/condition)). Statistical analyses were performed by comparing mock-infected or pcDNA-transfected control with corresponding condition with a nonparametric T-test. * p < 0.05, ** p < 0.01, *** p < 0.001.

