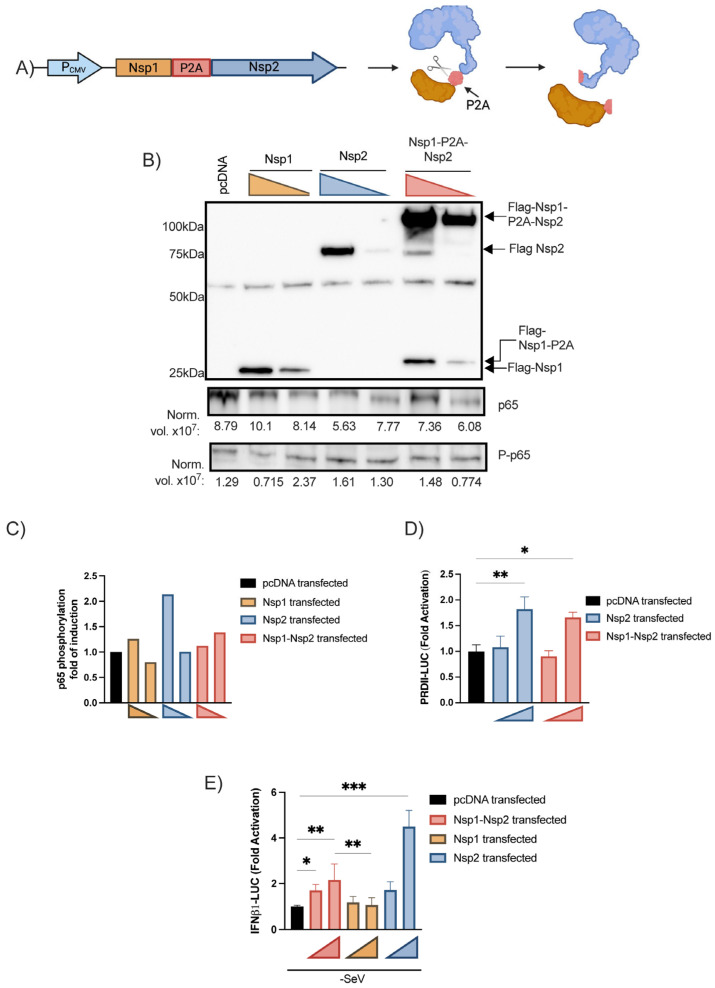
Figure 6.
Effects of Nsp1-Nsp2 polyprotein on IFNβ and ISRE-luc promoter activation and p65 subunit phosphorylation. Schematic representation of the Nsp1-P2A-Nsp2 encoding vector cleaved products (A). Nsp1 and Nsp2 coexpression and p65 expression following polyprotein vector transfection (B) and the relative p65 phosphorylation (C). HEK293T were seeded in 6-well plate. Twenty-four hours after, cells were transfected with 0.4 pmol or 0.2 pmol of Nsp1 expression vector, Nsp2 expression or Nsp1-Nsp2 polyprotein vector. Forty-eight hours post-transfection, cells were lysed with Halt Phosphatase Inhibitor Cocktail and detected by Western Blot with anti-FLAG (viral protein), anti-p65, phospho-NF-κB-p65-Ser536, and Stain-Free Imaging Technology® as loading control (Supplementary Figure S2) expressed as normalized levels (Norm. vol. ×108) below the blot. Then, NF-κB p65 phosphorylation was normalized with p65 subunit expression and expressed as fold of induction relative to the mock-infected control. This experiment was performed twice, and one representative experiment is shown. Effects of Nsp1-Nsp2 on PRDII reporter activation, (D) IFNβ1-luc, (E). IFNβ1 essay was performed as described above with 20 or 80 fmol of vector encoding for Nsp1, Nsp2 or Nsp1-Nsp2 polyprotein. PRDII reporter essays were performed using 40 or 80 fmol of following vectors. All experiments were performed twice in triplicate and the compilation of the data is shown. Results are expressed as fold activation relative to the pcDNA mock-infected control (mean ± SD, n = 6 replicates/condition). The Nsp1-Nsp2 and Nsp1 conditions were compared to the mock control using nonparametric one-way ANOVA with Dunn’s correction. The Nsp1-Nsp2 and Nsp1 conditions were compared together using nonparametric T-test. The Nsp2 transfection conditions were compared to the control using nonparametric one-way ANOVA with Dunn’s correction. * p < 0.05, ** p < 0.01, *** p < 0.001.

