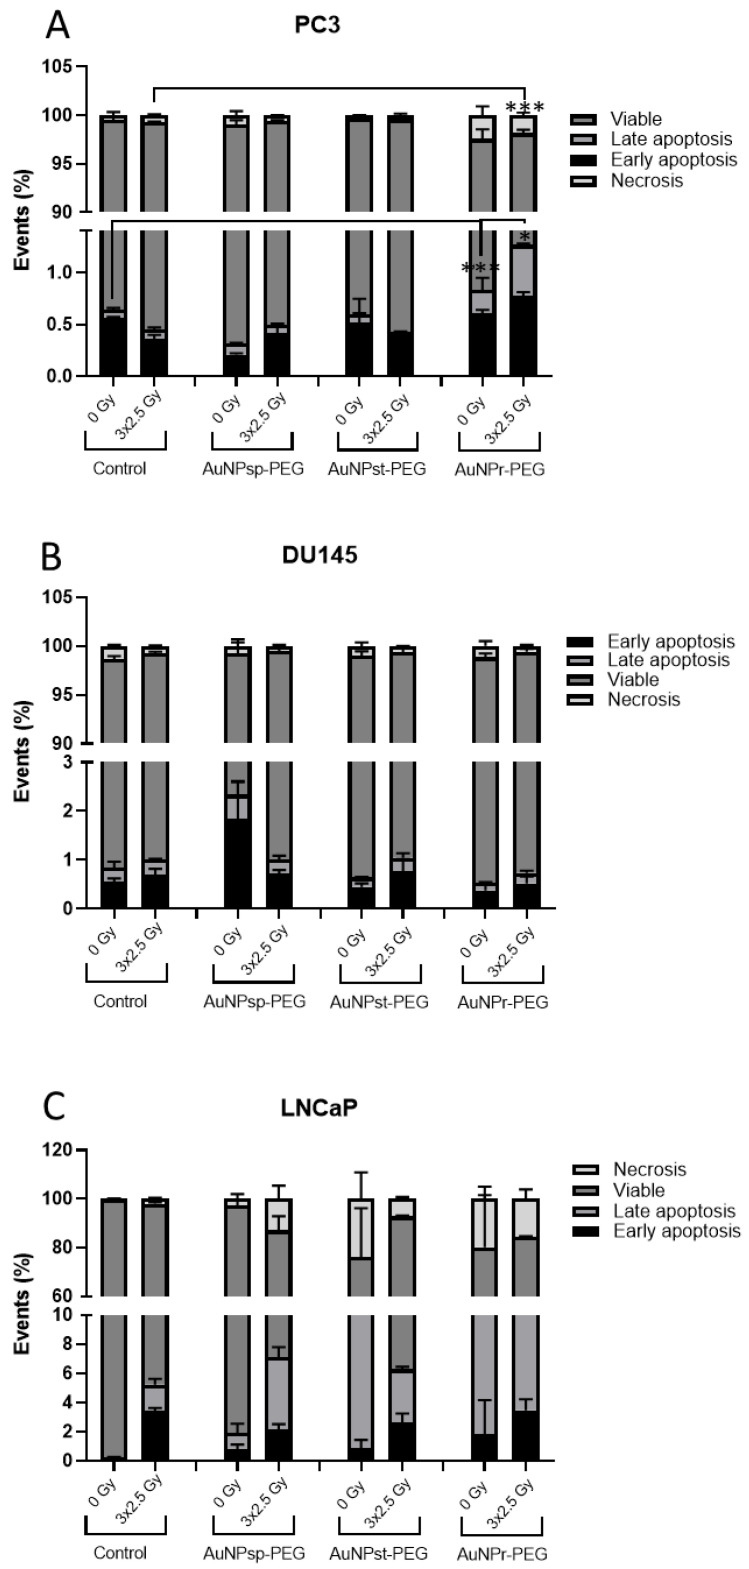
Figure 7.
Cell apoptosis assay using annexin V–CF Blue/7-aminoactinomycin D (7-AAD). Graphs show the quantification of the percentage of apoptotic cells in PC3, DU145, and LNCaP cells. The results were obtained using flow cytometry assay after Annexin V/7-AAD staining and average percentage of apoptotic cells in (A) PC3, (B) DU145, and (C) LNCaP cells treated with different conformations of AuNPs—spherical (AuNPsp-PEG), star (AuNPst-PEG), and rod (AuNPr-PEG) and irradiated with 3 fraction of 2.5 Gy of RT. The obtained results were compared to the respective control groups with and without IR and are presented as mean ± SD. AuNPsp-PEG, PEGylated spherical gold nanoparticles; AuNPst-PEG, PEGylated gold nanostars; AuNPr-PEG, PEGylated gold nanorods. The significance of the different treatments compared to the control of the respective day are shown as * p < 0.05, *** p < 0.001.

