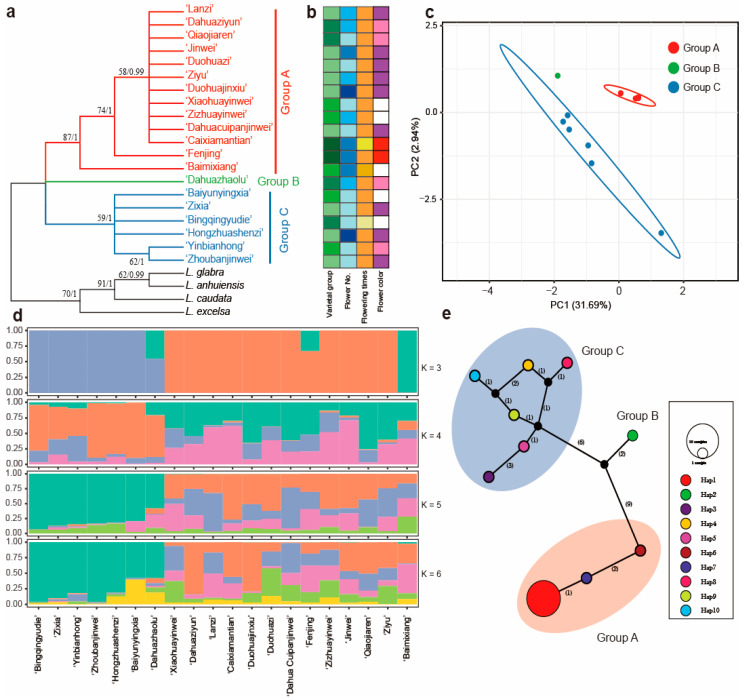
Figure 5.
Intraspecific diversity and genetic structure of 20 Lagerstroemia indica cultivars based on nrDNA dataset. (a) phylogenetic tree. ML bootstrap support values/Bayesian posterior probabilities are shown at each node; (b) phenotypic characterization; (c) principal component analysis; (d) population structure analysis with K = 3, 4, 5, and 6; (e) TCS network of 10 haplotypes from the nrDNA sequences. The number of mutational steps is shown on the lines, and the size of the pie chart represents the number of the accessions. The black circles are extinct haplotypes, and the haplotype for each sample is listed in Table S4.

