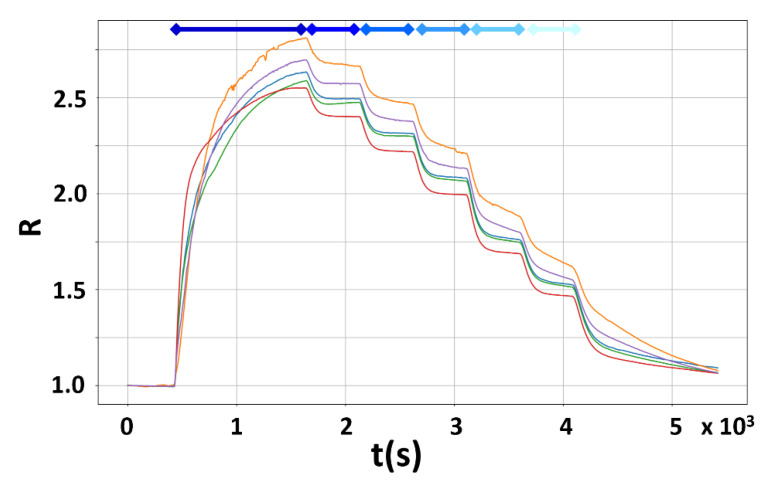
Figure 7.
Sensor responses vs. time to decreasing CO concentrations in dry air. The superimposed responses of five representative sensors (red, green, blue, violet, and orange lines; the 1.0 response corresponds to zero CO concentration; Equation (1)) exposed to progressively decreasing CO concentrations (10, 8, 6, 4, 2, and 1 ppm, indicated by the progressively lightening blue bars) are plotted vs. time. Each CO exposition lasted 10 min.

