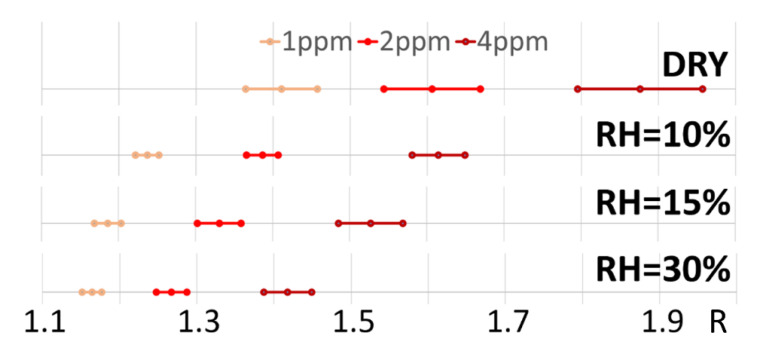
Figure 10.
Confidence intervals for sensor responses at each RH percentage. The confidence intervals were calculated on the responses (n = 39; Figure 8) at 1, 2, and 4 ppm CO concentration (orange, light red, and dark red intervals, respectively), at 0, 10, 15, 30 % of RH.

