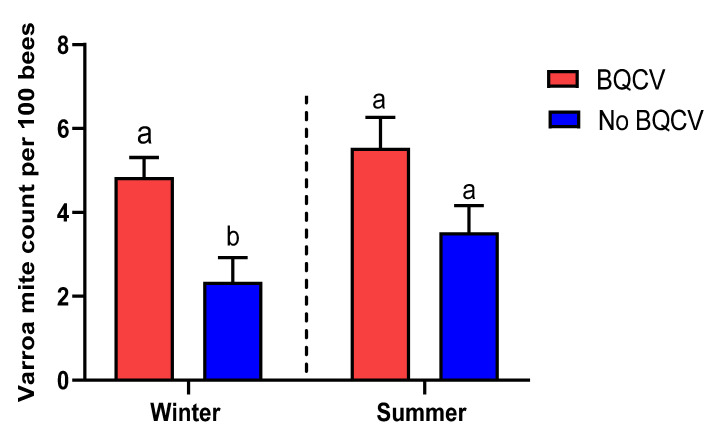
Figure 4.
Association between viral prevalence and varroa infestation. Columns represent the mean count of varroa mites per 100 bees (± SEM). Different lower-case letters indicate a statistically significant difference (Student’s t-test with Bonferroni correction for multiple testing, adjusted p < 0.05) in varroa count between colonies infected or not infected with BQCV in the winter season.

