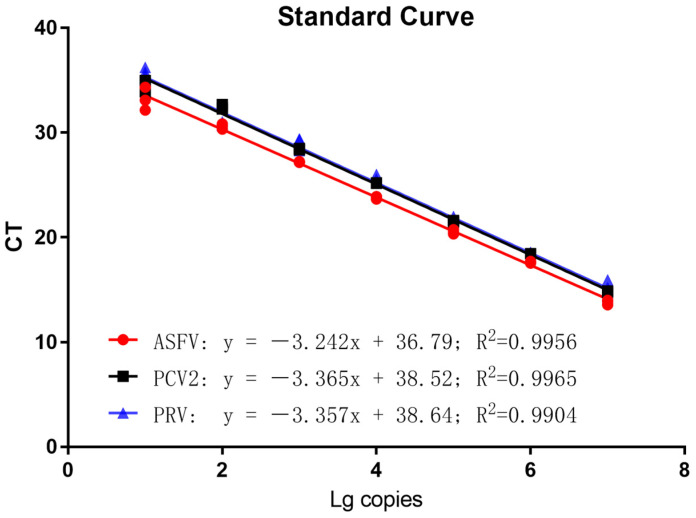
Figure 1.
Standard curves of the multiplex real-time qPCR. Establishment of a standard curve for TaqMan probe-based multiplex real-time qPCR. The logarithm of the number of copies is the horizontal axis. The vertical axis represents Ct values. Each point represents the mean value of three duplicates of plasmid that have been diluted. The optimal standard formula for ASFV is y = 3.242x + 36.79, with a correlation coefficient of 0.9956; the optimal standard formula for PCV2 is y = 3.365x + 38.52, with a correlation coefficient of 0.9965; and the optimal standard formula for PRV is y = 3.357x + 38.64, with a correlation coefficient of 0.9904.

