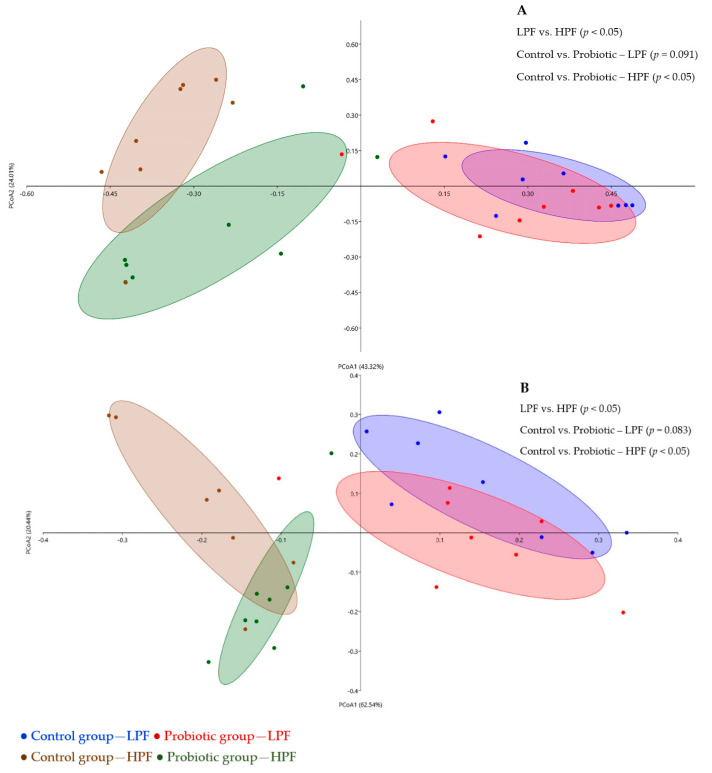
Figure 4.
Principal coordinate analysis (PCoA) of the composition of bacterial communities (A) and its functional genes (B) of control and probiotic groups fed the lower protein and fiber diet (LPF, day 21) and the higher protein and fiber diet (HPF, day 49). The figure was elaborated using the Bray–Curtis dissimilarity method and represents the degree of difference among samples. Each square/dot represents an animal. p-values between comparisons are from ANOSIM analysis.

