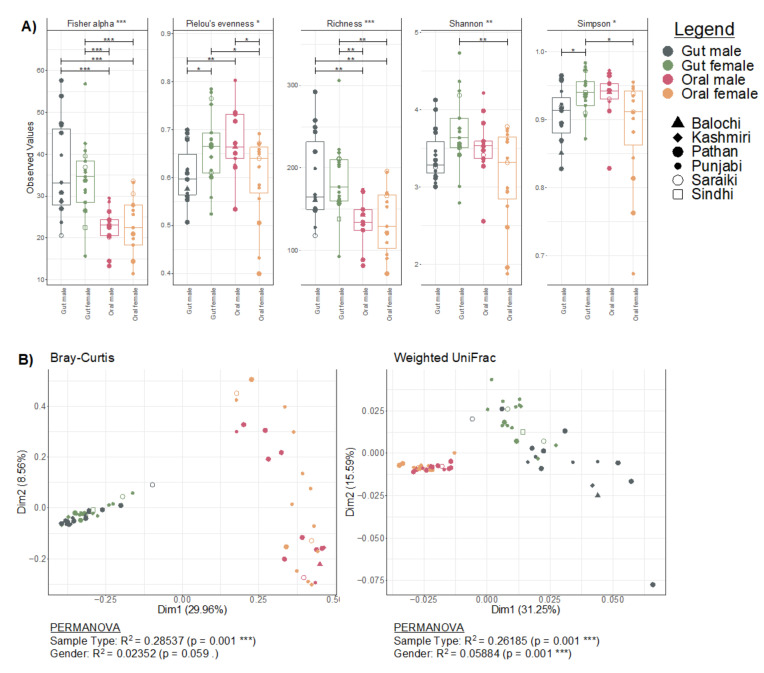
Figure 1.
Diversity estimates. (A) Commonly used alpha diversity indices with overall significance considering all four cohorts (gut male, gut female, oral male, and oral female) represented in the strip legends whilst pair-wise differences if significant (based on ANOVA) are represented by lines connecting two categories. (B) Principal coordinate analysis (PCoA) using different several dissimilarity indices (Bray-Curtis and weighted UniFrac) where ellipses were drawn using 95% confidence intervals based on the standard error of ordination points for a given category. Beneath each figure are the R2 values (along with p-values if significant) calculated from PERMANOVA. The significances are shown with p < 0.1, * p < 0.05, ** p < 0.01, or *** p < 0.001.

