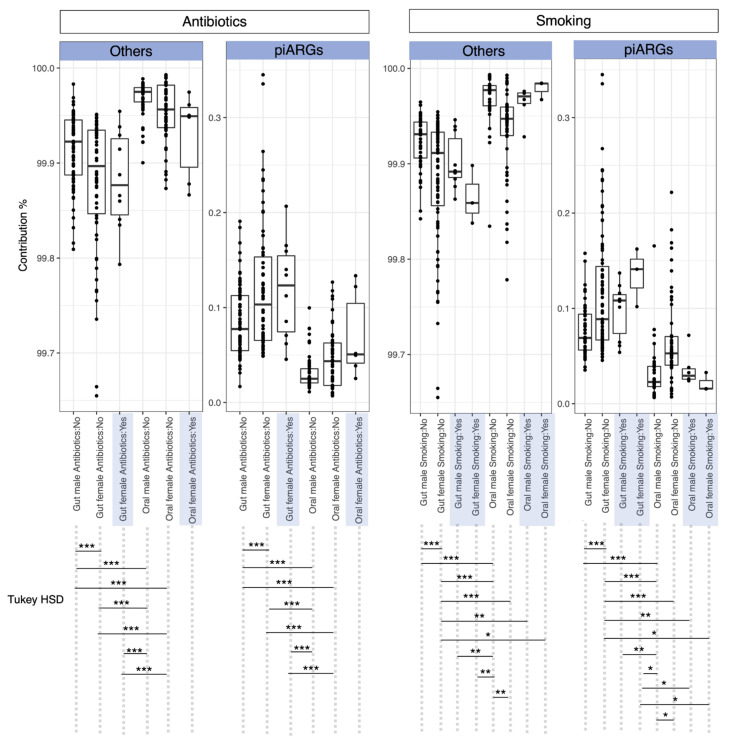
Figure 2.
Bray-Curtis contribution of predictive antimicrobial resistance genes (piARGs) to the overall beta diversity within the categories. The plot shows pair-wise differences between samples for each category with left set of panels showing organization by antibiotic status whilst right set of panels show organization by smoking status, respectively. “Others” represent the contribution of the remaining KOs that are not identified as potential AMR genes. Higher contributions represent higher intersample variability in terms of piARGs. Lines connecting categories shows significant relationships (Tukey HSD) with * p < 0.05, ** p < 0.01, or *** p < 0.001.

