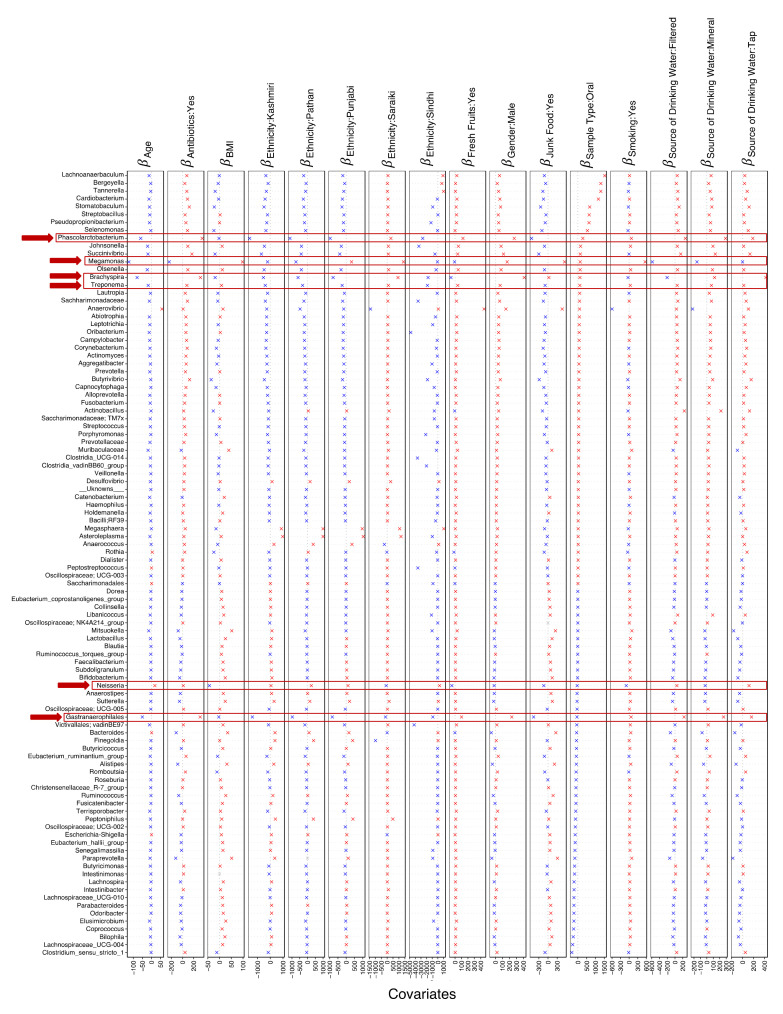
Figure 4.
coefficients returned from GLLVM procedure for covariates considered in this study. Top 100 most abundant genera were considered, incorporating both continuous data (age, BMI) as well as categorical labelling of samples. Those coefficients which are positively associated with the microbial abundance of a particular species are represented in red colour whilst those that are negatively associated are represented with blue colour, respectively. Since the collation of ASVs was performed at genus level, ASVs that cannot be categorized based on taxonomy are collated under the “__Unknowns__” category. Genera that stand out in terms of significances with multiple covariates are highlighted with a red border.

