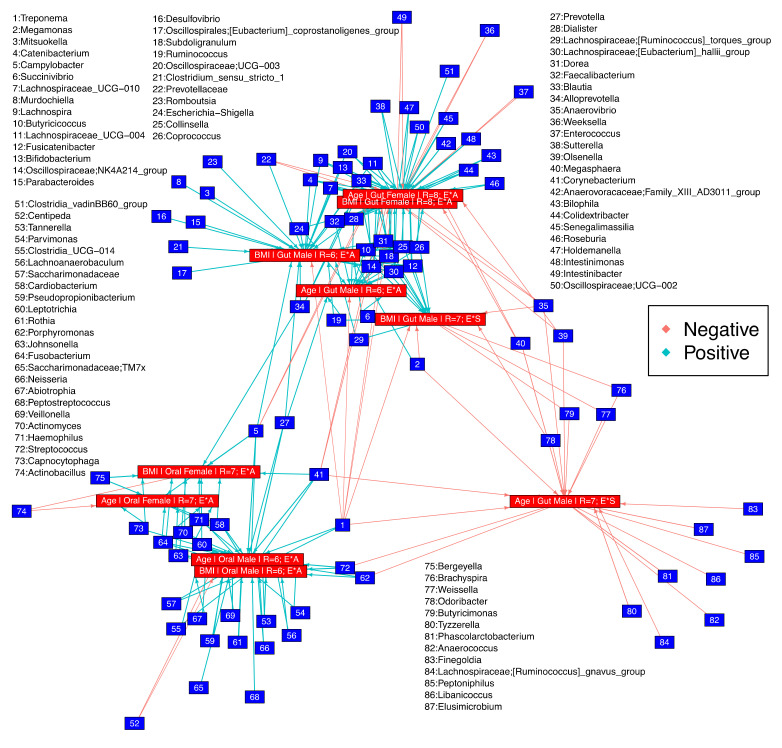
Figure 5.
Relationships recovered after applying Hurlbert’s BN to two environmental properties, age and BMI on different sets of environments as a combination of ethnicity and antibiotics usage status (E*A) or ethnicity and smoking status (E*S) with R representing the possible sets of environments. Genera tagged as “Positive” increase in abundance, whilst those tagged as “Negative” decrease in abundance in relationship to the environmental property considered as well as the target set of environments. Further details are given in Supplementary Figure S3.

