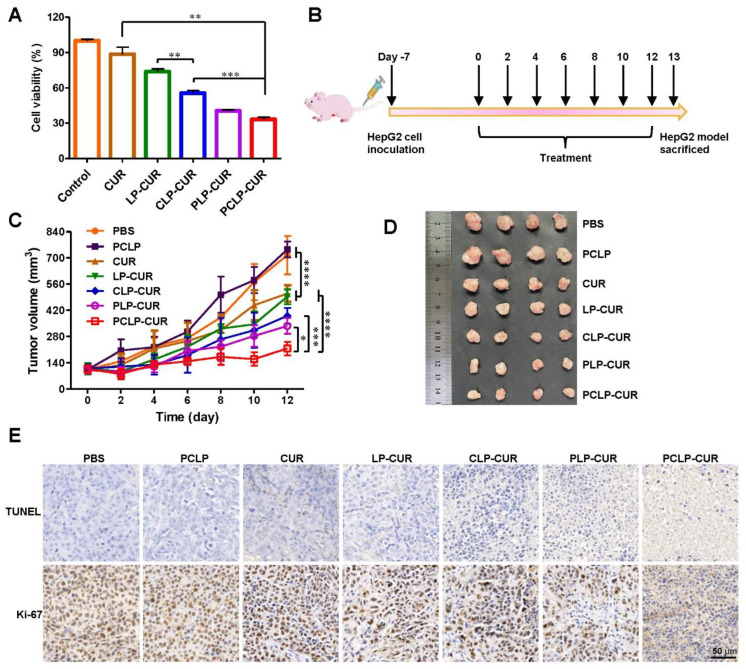
Figure 5.
Enhanced therapeutic efficacy of PCLP-CUR. (A) Cytotoxicity of various formulations (CUR concentration: 20 µM) against HepG2 cells after 48 h incubation. ** p < 0.01, and *** p < 0.001 (n = 5). (B) Schematic diagram of the timeline for the experiment. (C) Tumor growth curves of HepG2 tumor-bearing BALB/c nude mice treated with different formulations. * p < 0.05, *** p < 0.001, **** p < 0.0001 (n = 5). (D) Representative images of tumors excised at the end of the experiment. (E) TUNEL and Ki-67 images of tumor tissues. The brown colors in the images indicated TUNEL-positive or Ki-67-positive cells.

